- Title
-
Fishing the molecular bases of Treacher Collins syndrome
- Authors
- Weiner, A.M., Scampoli, N.L., and Calcaterra, N.B.
- Source
- Full text @ PLoS One
|
Developmental expression pattern of tcof1 by whole mount in situ hybridization. Lateral (A–I, K, L, N–Q, S) and dorsal (J, M, R and T) views (anterior regions to the left) of zebrafish embryos hybridized with anti-sense (A–D, I, J, L, M, O, P, and R–T) or sense (E–H, K, N and Q) zebrafish tcof1 probes. The following stages were analyzed: 2-cell stage (A and E), 6 hpf (B and F), 10 hpf (C and G), 13 hpf (D and H), 24 hpf (I–K), 48 hpf (L–N), 72 hpf (O–R), and 120 hpf (S–T). Abbreviations: cs, craniofacial structures; de, diencephalic region; e, eye; g, gut; mb, midbrain; hb, hindbrain; l, lenses; op, olfactory pits; ot, optic tectum; pa, pharyngeal arches; pf, pectoral fin buds. Scale bar: 180 μm for A–H; 210 μm for I, J and P; 266 μm for K; 320 μm for L, M and R; 380 μm for N, O, and S–T; 530 μm for Q. |
|
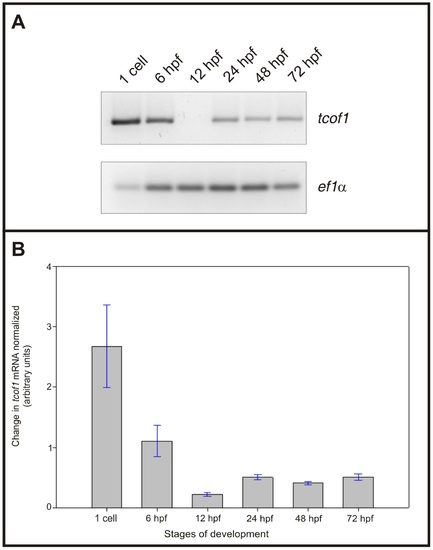
Zebrafish tcof1 mRNA developmental expression pattern determined by semi-quantitative RT-PCR. A: Agarose gel electrophoresis of semi-quantitative RT-PCR products amplified for zebrafish tcof1 and ef1α mRNAs at the 1-cell stage, 6, 12, 24, 48, and 72 hpf stages. B: Bar graph of zebrafish tcof1 mRNA expression profile during embryonic development, normalized to ef1α expression (n = 3). EXPRESSION / LABELING:
|
|
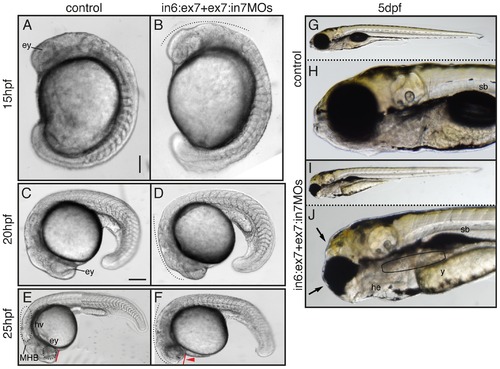
Phenotypic analysis of zebrafish tcof1 MO-knockdown. Lateral views (anterior to the left) of 15 hpf (A–B); 20 hpf (C–D); 25 hpf (E–F) embryos; and 5 dpf (G–J) larvae. Embryos were injected at the 1-cell stage with 1× Danieau (A, C, E, G and H) or in6:ex7-MO+ex7:in7-MO (B, D, F, I and J). At 20–25 hpf, the retina and midbrain-hindbrain regions showed a dark pigmentation (dotted lines), suggesting the presence of apoptotic cells. Abbreviations: ey, eye; he, heart edema; hv, hindbrain ventricle; MHB, midbrain-hindbrain border; sb, swim bladder; y, yolk. Scale bar: in A, 112.5 μm for A–B; in C, 160 μm for C–D, 260 μm for E–F, and 360 μm for G and I. PHENOTYPE:
|
|
Zebrafish tcof1 morphants showed reduced NC-specifier gene expression patterns. Lateral (G, I, K, and M) and dorsal (A–F, H, J, L, and N) views of control (A, C, E, and G–J) and in6:ex7-MO+ex7:in7-MO-treated (B, D, F, K–N) embryos. Embryos at 14 hpf were analyzed for foxD3 (A–B and E–F) and sox9b (C–D and G–H) expression patterns using whole-mount in situ hybridization. Abbreviations: de, diencephalic; hb, hindbrain; mb, midbrain; mhb, mid-hindbrain; ov, otic vesicles; s, somites. Scale bar: 185 μm for A–N. EXPRESSION / LABELING:
|
|
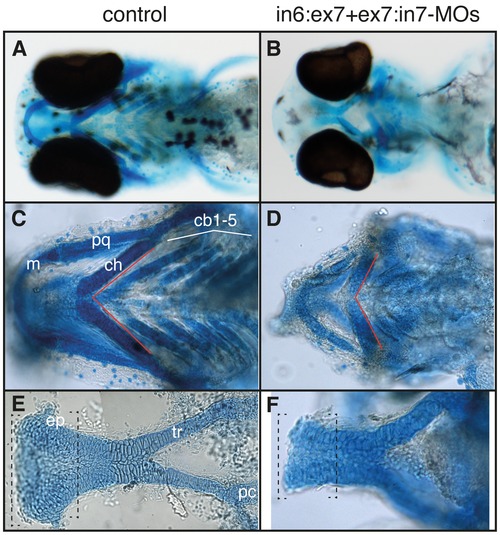
tcof1 loss-of-function adversely affects zebrafish craniofacial cartilage development. Ventral (A–D), and dorsal views (E–F) (anterior to the left) of control (A, C, and E), and in6:ex7-MO+ex7:in7-MO-treated (B, D, and F) 4 dpf larvae stained with Alcian blue. Skeletal staining of control and morphants reveals hypoplasia of numerous craniofacial cartilages. Cranioskeletal hypoplasia is evident in the frontal, premaxillary, and maxillary elements. Abbreviations: cb1–5, ceratobranchial arches 1–5; ch, ceratohyal; ep, ethmoid plate; m, Meckel′s cartilage; pc, polar cartilage; pq, palatoquadrate; tr, trabecula. PHENOTYPE:
|


