- Title
-
Reversing blood flows act through klf2a to ensure normal valvulogenesis in the developing heart
- Authors
- Vermot, J., Forouhar, A.S., Liebling, M., Wu, D., Plummer, D., Gharib, M., and Fraser, S.E.
- Source
- Full text @ PLoS Biol.
|
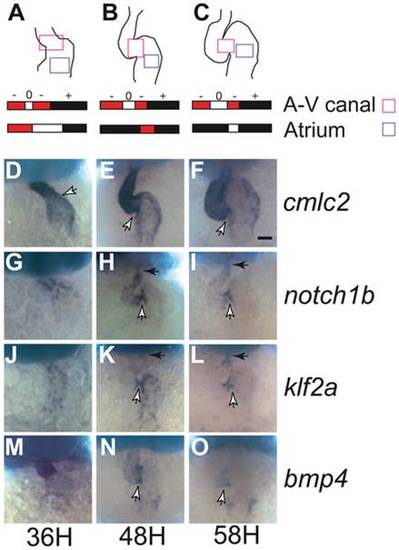
Transvalvular oscillatory flow patterns change during heart valve morphogenesis and gene expression in the AV canal. (A–C) Average transvalvular flow direction as a function of time for wild-type hearts as seen in the AV canal (light magenta box) or atrium (light blue box) between 36, 48, and 58 hpf in the area highlighted in the heart drawings (ventral view, anterior to the top). Anterograde flow from the atrium to ventricle is shown in black, retrograde flow from the ventricle to the atrium in red, and no flow between the chambers is shown in white. The sequence of time segments with retrograde, anterograde, and no-flow fractional periods are depicted in red, black, and white, respectively. The retrograde flow fraction (RFF) is the fraction of the cardiac cycle that is red. (D–F) cmlc2 expression reveals changes in heart morphology. cmlc2 is expressed in the heart tube in the anterior region at 36 hpf (D), and is expressed strongly in the ventricle and weakly in the atrium at 48 and 54 hpf (E and F). (G–O) Expression of notch1b, klf2a, and bmp4 progressively becomes localized to the AV canal during valve specification. mRNA distribution of notch1b (G–I), klf2a (J–L), bmp4 (M–O) at 36 hpf (D, G, J, and M), 48 hpf (E, H, K, and N), and 56 hpf (F, I, L, and O). notch1b is found in the anterior part of the heart tube at 36 hpf (G), and becomes stronger in the AV canal and in the ventricle at 48 hpf (H). At 54 hpf, notch1b expression becomes restricted in the AV canal and the outflow tract (I). klf2a expression is found throughout the heart tube at 36 hpf (J) and becomes stronger in the AV canal and in the atrium at 48 hpf (K). At 56 hpf, klf2a is exclusively expressed in the AV canal and the outflow tract, displaying an expression pattern very similar to notch1b (L). bmp4 expression is found in the anterior part of the heart tube at 36 hpf (M) and becomes progressively concentrated at the level of the AV canal from 48 to 54 hpf (N and O). Anterior to the top, white arrows point to the AV canal, black arrows to the outflow tract. |
|
Decreased retrograde flow via lowered blood viscosity affects valve morphogenesis. (A–D) Flow pattern at 48 hpf in (A) control and after (B) gata1, (C) gata2, and (D) gata1/2 knock down. gata2 inactivation leads to a dramatic decrease in the RFF, whereas gata1 and gata1/2 knock downs exhibit increased RFF compared to the control. (E–H) Confocal sections of the valve-forming region in (E) control, (F) gata1, (G) gata2, and (H) gata1/2 morphants. Only gata2 morphants at 96 hpf show valve dysgenesis. Scale bar indicates 50 µm. (I–K) Quantitative RT-PCR showing the expression level of several flow-responsive genes after gata1, gata2, or gata1/2 knock down. **p<0.01, ANOVA. (L) Percentage of embryos displaying valve malformation at 96 hpf (red bar), hematocrit level (yellow bar), and RFF (blue bar) observed in morphants and controls at 48 hpf. The proportions were significantly different at a 10% level of significance (α = 0.1). (M) Outline summarizing the experimental outcome of manipulating oscillatory flow by decreasing circulating blood cells. The color code for gene expression is the same as in (I). |
|
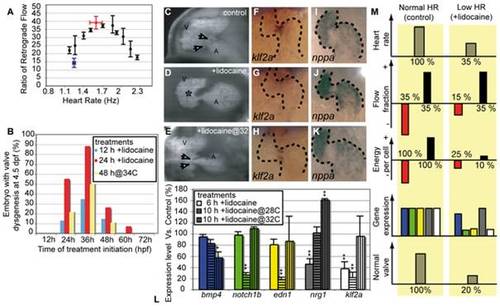
Decreased oscillatory flow decreases klf2a expression. (A) RFF is decreased by alterations in heart rate. The highest RFF is seen at the control heart rate (>30% between 1.5 and 2 Hz) at 48 hpf. Raising fish at lowered or elevated temperatures slows or speeds heart rate and significantly decreases RFF. Lidocaine treatment decreases heart rate and RFF (blue data point). The decreased heart rate and RFF is rescued by elevating the temperature to 34°C (red data point). (B) Decreased RFF from treatment with lidocaine or with high-temperature (34°C) leads to valve defects. The maximal effect is observed when treatment is initiated at 36 h. (C–E) Valve formation in normal and lidocaine treated embryos. (C) Embryos that were raised in control conditions have valve leaflets (white arrows). (D) Embryos in which RFF was decreased by lidocaine treatment from 31 to 55 hpf have endocardial tissue thickening (asterisk) but no valve leaflets are apparent (50%, n = 36). (E) Heart valve dysgenesis in fish exposed to 0.15% lidocaine for 24 h is rescued by incubating it at 34°C to restore normal RFF. Heart valve leaflets are present and function normally (white arrows). All embryos are imaged at 96 hpf. A, atrium; V, ventricle. (F–H) klf2a expression in 46-hpf-old embryos is altered by lidocaine treatment. (F) klf2a expression is localized at the AV boundary in control embryos. (G) klf2a expression decreases after 15-h lidocaine treatment (90%, n = 67). (H) Restoring heart rate and RFF to normal by raising the fish at 34°C restores klf2a expression (90%, n = 45). Anterior to the top. (I–K) nppa expression remains largely unaffected by lidocaine treatment and temperature rescue. (L) Quantitative RT-PCR showing the expression level of several flow-responsive genes after lidocaine treatment. klf2a expression is significantly decreased after 6 and 10 h of treatment and is restored by incubation at 34°C; 100% of expression corresponds to a normal expression level. *p<0.05; **p<0.01, ANOVA. (M) Outline summarizing the experimental outcome of decreasing oscillatory flow by decreasing heart rate. The color code for gene expression is the same as in (L). EXPRESSION / LABELING:
|
|
Morpholine antisense oligonucleotide treatment decreases expression of the flow-responsive gene klf2a results in valve dysgenesis. (A-D) Valve leaflets scored at 96 hpf show effects of klf2a MO. (A and C) Sham-injected embryos form normal heart valves. (B and D) klf2a MO-treated embryos display valve dysgenesis, often with a complete absence of valve leaflets. (C and D) Detailed views of valve morphology. (C) Control embryo has clearly distinguishable valve leaflets (arrows). (D) klf2a MO-treated embryo has no valve leaflets forming from the endocardium (arrow) (52%, n = 46). The proportions were significantly different at a level of significance ± = 0.01. Scale bars indicate 50 μm. (E and F) Average flow pattern at 48 hpf in controls (E) and klf2a morphants (F) showing that the RFF is unaffected in the mutants but that the heart rate is slightly decreased. (G-L) Expression of three marker genes at 48 hpf in normal and klf2a morphants. (G-J) nppa expression is normal in the klf2a morphants, showing that chamber specification occurs independently of klf2a. (I and J) bmp4 mRNA distribution at 48 hpf showing that expression is decreased in the MO-treated embryo in the AV node region at 48 hpf (n = 23, 40%; compare expression at arrow in panels [I and J]). (K and L) notch1b expression at 48 hpf decreases in the AV boundary of the klf2a morphants (n = 45, 71%). Arrows point to the AV boundary in all panels (G–L). (M) Summary of quantitative RT-PCR showing the expression level of flow-responsive genes in klf2a morphants. Expression of all genes decreases significantly, confirming the down-regulation of bmp4 and notch1b observed by ISH. **p<0.01, ANOVA. (N) Summary diagram of klf2a function during heart valve formation. klf2a acts as a transcriptional relay between the reversing flow generated by the circulating blood cells at the AV canal and several genes activated in the AV endothelial cells (such as notch1b, neuregulin1, and endothelin1). klf2a also affects the expression of bmp4, revealing a possible interaction between myocardium and endothelium essential for valve morphogenesis. |
|
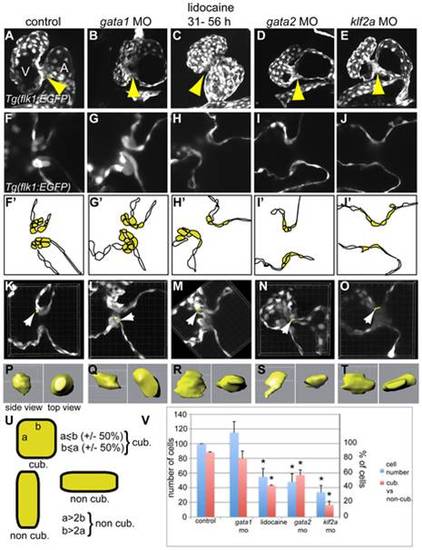
Comparison of the valve phenotype between the different treatments affecting valvulogenesis in transgenic Tg(flk1:EGFP) zebrafish at 72 hpf. GFP is expressed in the endothelial cell layer and highlights the developing valves. (A, F, and F′) control embryo, (B, G, and G′) gata1 morphant, (C, H, and H′) lidocaine treated, (D, I, and I′) gata2 morphant, and (E, J, and J′) klf2a morphant. Each treatment lead to an incomplete ingression of the endothelial cells in order to make a functional leaflet except in gata1 morphants. (F′-J′) Schematic representation of the panels (F-J) underlining the endothelial cells within valve-forming region (yellow) and the heart lumen (white). A, atrium; V, ventricle. (K–O) Three-dimensional reconstruction of 10 µm depth of the AV area in control (K), gata1 morphants (L), lidocaine-treated embryo (M), and gata2 (N) and klf2a (O) morphants. The white arrows point to the cell that has been reconstructed in three dimensions and which is presented in (P-T). (P-T) Side view (left) and top view (right) of a reconstructed cell of the AV canal. (U) Schematic drawing showing the approach used to define cuboidal versus non-cuboidal cell shape. (V) Graph summarizing the number of cells counted in the AV canal (corresponding to the yellow cells in [F′–J′]) (blue bars), and the ratio between cuboidal versus non cuboidal cell shape (red bars). Yellow arrows in (A-E) point to the endocardial ring. PHENOTYPE:
|
|
Oscillatory flow is observed in the AV canal before valves become functional. (A-D) Confocal scans of hearts (ventral view, anterior to the top) at four developmental stages showing the morphology of the developing heart between 36 and 120 hpf. The endocardial tissue in the AV canal at 48 hpf in shown by the arrow in (C). Valve leaflets appear at 84 hpf and are mature by 120 hpf. The black box underlines the location of blood flow analysis for each stage (A-D). Scale bar indicates 50 μm. (E-H) Transvalvular flow direction over time shows that mature valve leaflets are necessary to prevent retrograde flow in the heart. Anterograde flow from the atrium to ventricle is shown in black, retrograde flow from the ventricle to the atrium in red, and no flow between the chambers is shown in white. |
|
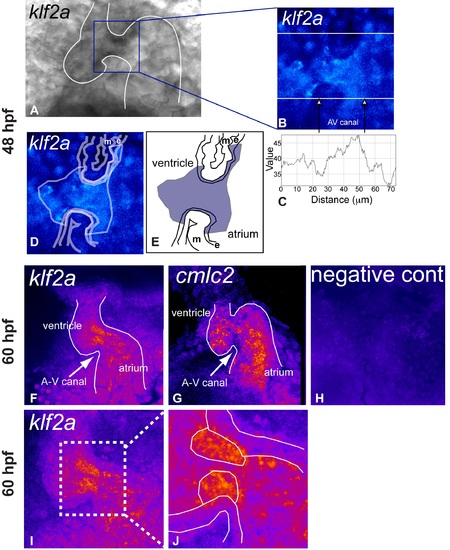
klf2a expression is localized to the endothelial cells of the AV canal. (A) Brightfield image of klf2a mRNA distribution at 48 hpf using NBT-BCIP revelation. (B) Maximal intensity projection of 15 sections obtained by confocal microscopy (633-nm excitation wavelength) reveals the specific expression domain of klf2a to the innermost cell layer of the heart. (C) Profile plot of the pixel intensity measured along the bottom white line in (B) showing increased signal in the AV canal (white arrows). (D and E) Drawings locating the endothelial (e) and myocardial (m) layer on the picture. (F, I, and J) Maximal intensity projection of ten sections obtained by confocal microscopy (633-nm excitation wavelength) reveals that the specific expression domain of klf2a increases and becomes brighter to the innermost cell layer of the heart at during the valve elongation stage (60 hpf). (G) By comparison, expression of cmlc2 labels the myocardium and not the endothelium. (H) Same imaging procedure using an embryo not labeled with NBT-BCIP showing no staining. |
|
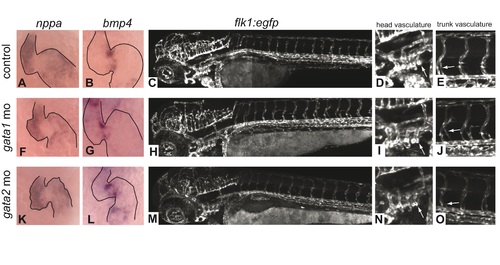
Decreased blood cells number do not affects heart chamber patterning as well as head and trunk vasculogenesis. (A, B, F, G, K, and L) nppa and bmp4 expression is unaffected in gata1 (F and G) and gata2 (K and L) morphants compared to controls (A and B) showing that heart chambers and AV canal patterning is normal when blood cell numbers decrease. (C-E, H-J, and M-O) GFP expression in Tg(flk1:EGFP) delimitates the cardiovascular system as it is limited to every endothelial cells in the embryo (C, H, and M). Details of the head (D, I, and N) and trunk (E, J, and O) vasculature in controls (C–E), gata1 (H-J), and gata2 (M-O) show that no obvious malformation of the cardiovascular system is visible when blood cell number decreases. Arrows in (D, I, and N) point to the fourth branchial arch; arrows in (E, J, and O) point to secondary sprouts of the trunk cardiovascular wiring. Panels (C, H, and M) are each a composite of two original images. |
|
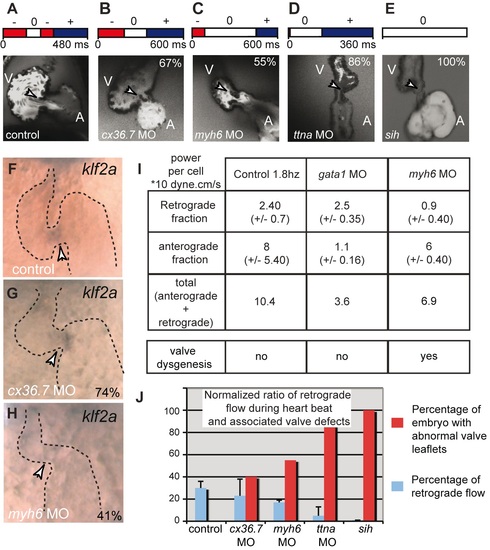
Decreased retrograde flow via changes in contractility affects valve morphogenesis. (A–H) Flow pattern at 48 hpf and associated confocal sections of the valve-forming region at 96 hpf in (A) control, (B) cx36.7 (see also Video S6), (C) myh6 (Video S6), (D) ttna (Video S6) knock downs, and (E) in the silent heart (sih) mutants. myh6, ttna, and sih inactivation leads to a dramatic decrease in the RFF and valve defects, whereas cx36.7 knock down has an almost normal RFF and valves compared to the control. (F–H) klf2a expression in (F) control, (G) cx36.7, and (H) myh6 morphants. Absence of klf2a expression was observed in myh6 morphants (41%, n = 36) (H), but normal expression levels were observed in cx36.7 morphants (75%, n = 50) (G). These two populations were significantly different (α = 0.1). (I) Energy expenditure comparison between control, gata1, and myh6 morphants during the retrograde, anterograde, or both flow direction phases. The apparition of valve dysgenesis coincides with a low energy expenditure during phases of retrograde flow rather than a reduction of the overall energy expenditure during phases of anterograde and retrograde flow. (J) Proportionally decreased RFF through treatment with cx36.7, myh6, or ttna MOs leads to an increase in valve defects. The maximal effect is observed in no flow (sih) or no RFF (ttna) conditions. |
|
Strong phenotype triggered by lidocaine treatment. (A) Control conditions (B) After treatment with lidocaine, 17% (n = 36) embryos do not have endothelial tissue thickening. (C and D) bmp4 expression in (C) lidocaine-treated and (D) untreated embryos. In treated embryos, the heart tube is very immature, a situation very similar to that observed in the no-flow conditions reported in [14]. Such embryos were not used for flow analyses or qPCR, nor were they tested for valve morphogenesis at later stages. White arrow points to the AV canal. |
|
notch1b expression after lidocaine treatment. notch1b is expressed at the AV boundary in control embryos (A and C) and after 5 h of lidocaine treatment (100%, n = 47; (B)) but disappears after 15 h of lidocaine treatment (61%, n = 36; (D)). Anterior is to the top. |
|
Expression of notch1b, bmp4, and cmlc2 in control ([A, C, and E], respectively) and klf2a MO-treated ([B, D, and F], respectively) embryos. A strong phenotype after klf2a MO treatment is visible in a minority fraction of embryos treated with klf2a MO, which display immature heart growth (13%, n = 20). In these strongly affected embryos, the heart tube morphology is similar to that observed in conditions were blood flow is suppressed (see [7]); they were not used for flow analysis, qPCR, or for scoring valve morphogenesis at later stages. |
|
Expression of three marker genes at 36 hpf in the heart of normal and klf2a morphants. (A and B) cmlc2 expression is essentially normal in the klf2a morphants, showing that chamber specification occurs independently of klf2a. (C and D) bmp4 mRNA distribution at 36 hpf showing that expression is normal in the MO-treated embryo in the AV node region at that stage. (E and F) notch1b expression decreases in the AV boundary of the klf2a morphants at 36 hpf (n = 24, 63%; compare expression at tip of arrows). Arrows point to the AV boundary in all panels. |
|
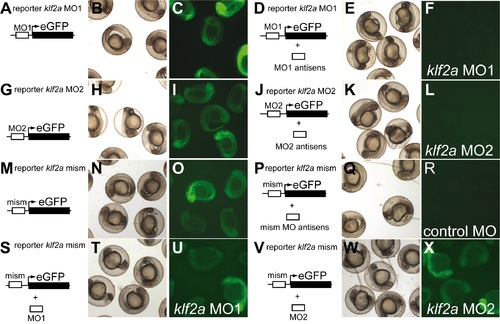
Validation of the MO strategy. (A-L) MOs against klf2a block the translation of eGFP fusion proteins carrying their target sequences. (M–X) Control MO (a mismatch of MO2) do inhibit the translation of eGFP fusion proteins carrying its target sequence (M-R), whereas MOs directed against klf2a cannot block the translation of the target sequence of the mismatch MO (S-X), validating the specificity of each MO. |
|
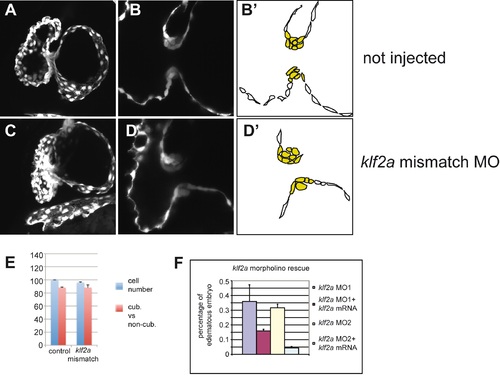
(A-E) Injection of klf2a mismatch morpholino does not affect valve invagination and cell shape. (F) Overexpression of klf2a mRNA rescues klf2a MO-mediated phenotype. (A-B′) Comparison of the valve phenotype between the different treatment affecting valvulogenesis using Tg (flk1:egfp) at 72 hpf. GFP is expressed in the endothelial cell layer and highlights the developing valves. (A, B, and B′) control embryo, (C, D, and D′) klf2a mismatch morphant. (B′ and D′) Schematic representation of the panels (B and D) outlining the endothelial cells within valve-forming region (yellow) and the heart lumen (white). Mismatch MO injection leads to a normal ingression of the endothelial cells and cuboidal cell rearrangement showing that leaflet invagination occurs properly and that there is no nonspecific effects due to MO injection. (F) Percentage of rescue obtained after overexpression of klf2a mRNA concomitantly with klf2a MO (n = 115 for MO1, n = 49 for MO2) compared with klf2a MO injected embryos (n = 84 for MO1 and n = 88 for MO2). A, atrium; V, ventricle. |

