- Title
-
Nlcam modulates midline convergence during anterior neural plate morphogenesis
- Authors
- Brown, K.E., Keller, P.J., Ramialison, M., Rembold, M., Stelzer, E.H., Loosli, F., and Wittbrodt, J.
- Source
- Full text @ Dev. Biol.
|
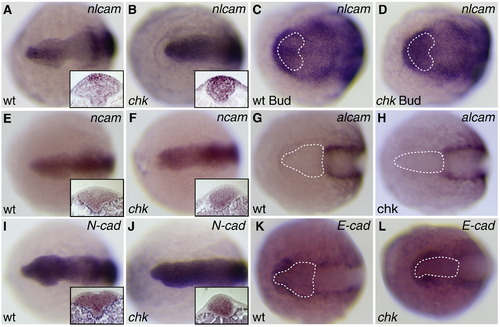
nlcam is specifically upregulated in the Rx3/chk mutant. Whole mount in situ expression patterns of CAMs in wild type (A, C, E, G, I, K) and chk mutant (B, D, F, H, J, L) embryos at the 6S (A, B, E–L) or Bud (C, D) stage. Dorsal views, anterior to the left. (A, B) nlcam, 6SS. Insets show cross sections through the anterior neural plate (dorsal is up), showing upregulation of nlcam in the chk presumptive eye field. (C, D) nlcam, Bud stage. nlcam is upregulated in chk at this stage, shortly after the onset of Rx3 expression (domain marked by white stippled line). No other CAMs tested show changes in expression pattern. E, F: ncam. G, H: alcam. I, J: N-cadherin. K, L: E-cadherin. Sections for ncam and N-cadherin, which are expressed in the eye field, are also shown. For alcam and E-cadherin, where there is no or very little expression in the eye, the Rx3 expression domain is marked by the white stippled line. EXPRESSION / LABELING:
PHENOTYPE:
|
|
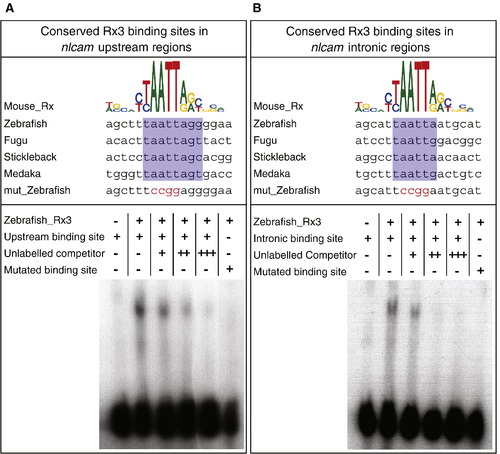
Electrophoretic mobility shift assays on Rx3 predicted binding sites. Upper panels: in the sequence alignment between the mouse RAX binding site and predicted Rx binding sites the upstream (A) and intronic (B) regions in 4 fish species, conserved nucleotide positions are highlighted in blue. Mutations made within the homeobox core binding site are highlighted in red. Lower panels: Rx3 predicted binding sites in zebrafish nlcam were tested by EMSA. Rx3 specifically binds to the oligonucleotides containing the RAX motif, but not to mutated versions. This binding can be competed away by increasing levels of unlabelled oligonucleotide. |
|
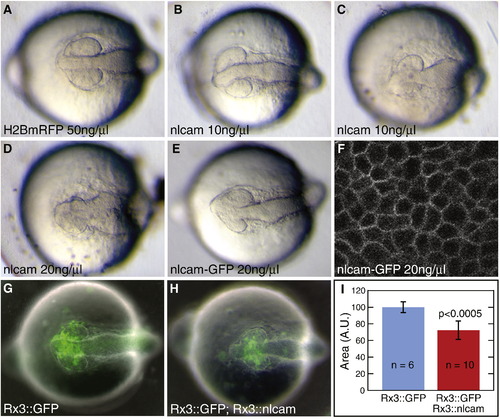
Overexpression of nlcam leads to a reduction in eye size. (A–E) 14SS embryos, injected at the one cell stage with H2BmRFP RNA (A), nlcam RNA (B–D) or nlcam-GFP RNA (E). nlcam overexpression leads to a reduction in eye size in a dose-dependent manner. nlcam-GFP RNA injection (E) causes a similar range of phenotypes. (F) GFP-tagged Nlcam is localised to the plasma membrane of RPCs. (G, H) 14SS embryos, injected at the one cell stage with Rx3::GFP (G) or a mixture of Rx3::GFP and Rx3::nlcam (H) plasmids. Cells expressing the transgenes are marked by GFP. Overexpression of nlcam exclusively in RPCs causes small eyes, while the rest of the embryo is unaffected. (I) Quantification of eye size at 14SS after DNA injection. The area of the optic vesicle, shown in arbitrary units ± standard deviation (set to 100 for the control embryos), is significantly smaller when nlcam is overexpressed. n = number of optic vesicles measured. |
|
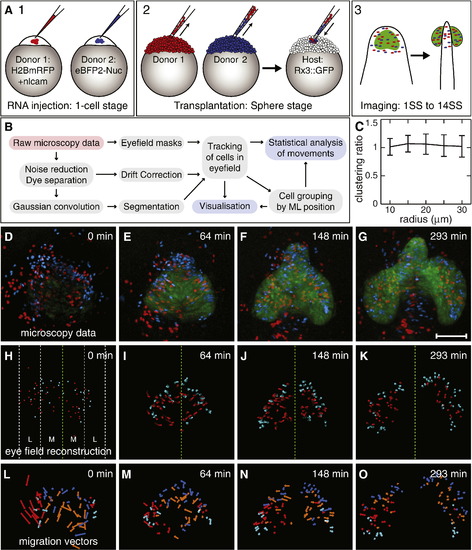
Analysis of the effects of Nlcam on cell migration during OV morphogenesis. (A) Outline of the experimental procedure. Embryos are injected at the one cell stage with either a mixture of H2BmRFP and nlcam RNAs or with eBFP2-Nuc RNA (1). Cells from both donors are transplanted into Rx3::GFP hosts (2). After the onset of GFP expression, embryos are imaged by confocal microscopy (3). (B) Outline of the processing pipeline. Red boxes show the input; grey boxes detail the processing steps; and blue boxes show the final output. (C) Clustering analysis of transplanted cells indicates that nlcam overexpression does not promote homophilic clustering. (D–G) Selected frames from Dataset 1, showing key points during optic vesicle morphogenesis. Between 0 and 64 min (D, E), RPCs are converging towards the midline. Subsequently, RPCs begin to evaginate (F). Approximately 5 h after the onset of imaging (G), the process is essentially complete. The eye field is marked in green; wt cells are blue; nlcam+ cells are red. Scale bar is 100 μm. (H-K) Rendered reconstruction of cells within the eye field at the same time points. Trails show the position of the nucleus over the previous 10 time points (∼ 20 min). Green dashed line indicates midline. White dashed lines in H indicate medial (M) and lateral (L) groupings used for analysis. (L–O) Vectorial visualisation of migration. For simplification, the data is collapsed in the DV axis. Arrows show migration direction and displacement of cells over the following 10 time points. Cyan: lateral wt cells. Blue: medial wt cells. Red: lateral nlcam+ cells. Orange: medial nlcam+ cells. |
|
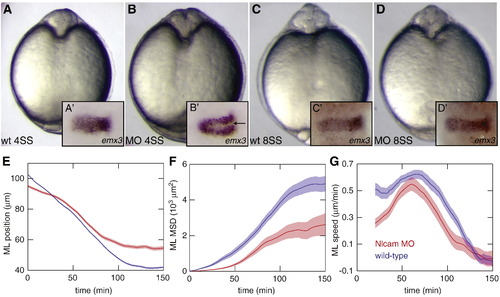
nlcam loss of function causes delayed convergence. (A–D) At 4SS, a deep cleft at the midline in nlcam ATG-MO injected (0.3 mM) embryos (B) indicates that forebrain cells have not yet converged to the midline, as they have in control embryos (A). This is confirmed by in situ hybridisation against emx3 (A′, B′). This phenotype is transient, as demonstrated by the recovered forebrain morphology by 8SS (C, D). (E–G) Graphs show selected statistics for forebrain cell convergence from a single dataset. (E) Position of cells relative to the midline. (F) MSD along the ML axis. (G) Speed along the ML axis. Blue = wt cells; red = nlcam-MO. EXPRESSION / LABELING:
PHENOTYPE:
|
|
Quantification and controls for nlcam over-expression and morpholino |
Reprinted from Developmental Biology, 339(1), Brown, K.E., Keller, P.J., Ramialison, M., Rembold, M., Stelzer, E.H., Loosli, F., and Wittbrodt, J., Nlcam modulates midline convergence during anterior neural plate morphogenesis, 14-25, Copyright (2010) with permission from Elsevier. Full text @ Dev. Biol.

