- Title
-
Zebrafish ale oko, an essential determinant of sensory neuron survival and the polarity of retinal radial glia, encodes the p50 subunit of dynactin
- Authors
- Jing, X., and Malicki, J.
- Source
- Full text @ Development
|
ale oko phenotype in the zebrafish retina. (A-B′) External phenotypes of akojj50 mutants (A′,B′), compared with their wild-type siblings (A,B). Dorsal (A,A′) and lateral (B,B′) views are shown at 5 dpf. (C-D′) Transverse sections of the ako (C′,D′) and wild-type (C,D) retinae at 4 dpf. (E,E′) Electron micrographs of wild-type (E) and mutant (E′) retinae at 3 dpf. OS, outer segment; IS, inner segment. Asterisks indicate abnormal mutant outer segments. (F-K′) Differentiation of retinal cells classes in ako mutants. Transverse cryosections through retinae of wild type (top) and akojj50 mutants (bottom). (F-G) Müller glia are visualized via the expression of a GFP transgene (F,F′, green, arrows) or by antibody staining against carbonic anhydrase (G,G′, red). Photoreceptors are stained with the Zpr-1 antibody (red in F,F′, green in G,G′). (H-J′) Transverse sections stained with antibodies to subpopulations of amacrine cells: anti-serotonin (H,H′, green), anti-neuropeptide Y (I,I′, red, arrows), anti-parvalbumin (I,I′, green) and anti-GABA (J,J′). (K,K) Sections through retinae of Tg(brn3c:mGFP) transgenic animals, which express GFP in ganglion cells (green). Photoreceptors are visualized with the Zpr-1 antibody (red). In G-K′, asterisks indicate the optic nerve. L, lens; rpe, retinal pigment epithelium; prcl, photoreceptor cell layer; inl, inner nuclear layer; ipl, inner plexiform layer; gcl, ganglion cell layer. Scale bars: 1 mm in A-B′; 40 μm in C,C′,F-K′; 30 μm in D,D′; 5 μm in E,E′. |
|
ale oko hair cell phenotype. (A-B′) Whole-mount staining of ear sensory maculae with anti-acetylated-α-tubulin antibody (green) and phalloidin (red, actin) to visualize hair cells and their stereocilia, respectively. Posterior (A′) and anterior (B′) maculae of ako mutants are shown. (C,C′) Electron micrographs of auditory hair cells in the posterior macula of wild-type (C) and ako mutant (C′) zebrafish larvae. Cellular debris (arrowheads) is present in the mutant tissue. (D,D′) In the ako mutant lateral line (D′), few hair cells survive by 5 dpf compared with the wild type (D). (E) Quantitation of hair cell numbers in the maculae of wild-type and akojj50 animals at 5 dpf. The average numbers of hair cells in the anterior (AM) and the posterior (PM) maculae are provided (n=6). For posterior macula, P<0.01 (Student′s t-test). (F) The average number of hair cells per lateral line neuromast in wild-type and akojj50 animals (n=6). At 4 and 5 dpf, P<0.0001 (Student′s t-test). A,A′,D,D′ show face views of the apical surface; in B-C′, apical is up. Scale bars: 5 μm in C,C′; 20 μm in A-B′,D,D′. PHENOTYPE:
|
|
The ale oko locus encodes a zebrafish dynactin 2 homolog. (A) Map of the ako genomic region and exon/intron structure of the ako transcript. The position of mutant sequence in the akojj50 allele is indicated (red arrowhead). (B,C) Comparison of sequence trace data from wild-type (B) and mutant (C) animals. The akojj50 mutation activates a cryptic splice site in the genomic sequence. This, in turn, introduces a 9-bp insertion (red) that encodes a premature stop codon. (D) RT-PCR amplification of the dynactin 2 transcript using a primer that recognizes the mutant insertion sequence. Lane 1, DNA ladder; lane 2, amplification of the mutant transcript produces a single robust band; lane 3, amplification of the wild-type transcript does not produce a detectable product; lane 4, BfaI digestion confirms the identity of the amplification product from the mutant; lanes 5 and 6, control PCR amplification of actin from wild-type (5) and mutant (6) animals. The positions of amplification primers in the wild type and mutant are indicated on the diagram below. (E-H) Phenocopy and rescue of photoreceptor defects in ako mutant animals. Transverse cryosections through embryonic retinae were stained with the Zpr-1 antibody to visualize double cones (red). Green signal in E,F originates from the Tg(brn3c:mGFP) transgene. The injection of ako (H), but not GFP (G), mRNA rescues photoreceptor morphology in ako mutants. L, lens. Scale bar: 40 μm. PHENOTYPE:
|
|
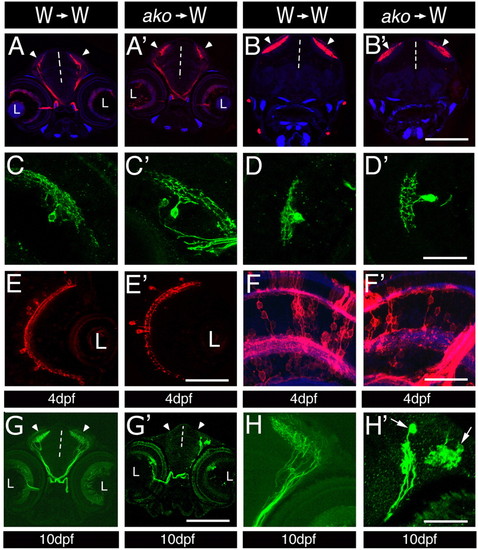
Cell-autonomous aspects of ako function in neuronal differentiation. (A-H′) Transverse sections through mosaic retinae at 4 (A-F′) and 10 (G-H′) dpf. Donor cells were derived from the following fluorescent protein transgenic lines: Tg(brn3c:mGFP) in A-D′ and G-H′ to visualize ganglion cells; Tg(pax6-DF4:mGFPs220) in E,E′ to isualize amacrine cells; and Tg(pax6-DF4:mCFPq01) in F,F′ to reveal the morphology of bipolar cells. Host tissue is unlabelled. Sections in A,A′ are anterior to those in B,B′. The genotypes of donor and host larvae are indicated above each column. No differences are observed between wild-type and mutant ganglion, bipolar or amacrine cells at 4 dpf. (G,H) Donor-derived wild-type ganglion cells differentiate densely branched processes in the optic tectum of wild-type hosts at 10 dpf. (G′,H′) By contrast, donor-derived akojj50 mutant cells differentiate few axons, which frequently do not branch, or exhibit an irregular branching pattern. In some cases, swellings form near the termini of akojj50 mutant axons (arrows in H′). Vertical dashed lines indicate the midline; arrowheads indicate the optic tecta; L, lens. Scale bars: 150 μm in A-B′,G,G′; 40 μm in C-D′,H,H′; 50 μm in E,E′; 30 μm in F,F′. |
|
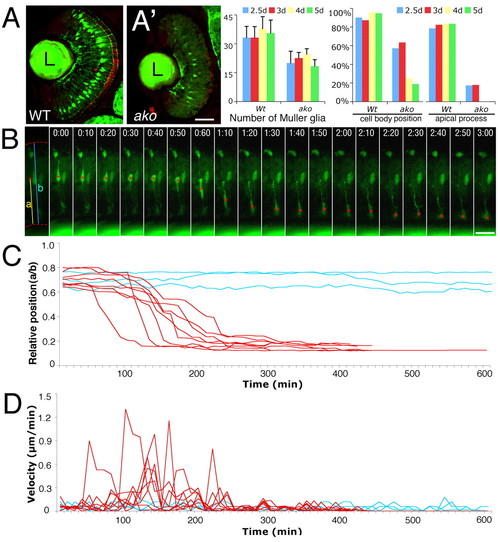
The phenotype of Müller glia. (A,A′) Transverse cryosections through the retinae of wild type (A) and akojj50 mutant (A′) lines at 60 hpf. Müller glia are visualized by Tg(gfap:GFP) transgene expression. Graphs to the right show the quantitation of these phenotypes. `Cell body position′ refers to the position of Müller cell bodies in the inner nuclear layer. (B) A series of images from a time-lapse recording of a mutant Müller cell. Time is indicated above each image in hours and minutes (h:min). Cell body positions are indicated with red asterisks. (C) Cell body position expressed as a ratio of its distance from the inner limiting membrane (parameter `a′ in B) and retinal thickness (parameter `b′ in B). Cell body positions during time-lapse recording sessions are plotted for three wild-type (blue) and eight mutant (red) cells. All data were collected from the peripheral retina from 72-96 hpf. (D) The velocity of perikaryal displacement calculated for the same set of cells as in C. L, lens. Scale bars: 40 μm in A,A′; 20 μm in B. |
|
Mosaic analysis of ako Müller glia mutant phenotype. (A-E′) Transverse cryosections through retinae of mosaic zebrafish at the stages indicated below each image. Blastomere transplantations were performed using the Tg(gfap:GFPmi2001; pax6-DF4:mCFPq01) donor double transgenic line either wild type or mutant at the ako locus, as indicated at the top of each column. A non-transgenic wild-type line was used as the host. Sections were stained with an anti-GFP antibody to visualize all donor-derived cells (both CFP and GFP expression, red). Fluorescence of endogenously expressed GFP marks donor-derived Müller glia (green signal appears yellow against the red background). Sections in E,E′ are stained with the Zpr-1 antibody to visualize the photoreceptor cell layer. No defects in the morphology of Zpr-1-postitive cells in the vicinity of abnormal glial cells were observed (asterisk in E′). (F) Quantitation of mosaic analysis data. Percentages of cells with normal cell body position and apical process are provided. (G) The apical process of the wild-type Müller cell. Arrowheads and arrows indicate OLM and OPL, respectively. Asterisks indicate Müller cell perikarya. L, lens. Scale bars: 20 μm in A-E′; 10 μm in G. |
|
Apical polarity determinants are mislocalized in Müller glia. Transverse cryosections through wild-type or ako mutant retinae at 3 dpf. Sections are stained with antibodies against Nok, ZO-1, aPKC or γ-tubulin as indicated. The expression of the Tg(gfap:GFP) transgene marks Müller glia (green). (A,B) Nok (red) and ZO-1 (blue) localization in wild-type (A) and ako mutant (B) Müller glia. (B′-B″′) Detail of image shown in B; red, green and far red (in blue) channels are shown separately. (C-F″) Higher magnifications of Nok (red), Has/aPKC (red) and ZO-1 (blue) staining patterns. Retinae of mutant (D-D″,F-F″) and wild-type (C-C″,E-E″) siblings are shown next to each other. Nok (C′,D′) and aPKC (E′,F′) proteins colocalize with ZO-1 (bottom row of images), both in apical processes of wild-type Müller glia and in displaced glia of ako mutant eyes. Each column presents images obtained from a single section. Red and far red (in blue) channels are shown separately. (G-H′) Centrosome localization in Müller glia. Transverse cryosections through the retina stained with an antibody against γ-tubulin (red) to visualize basal bodies (arrows). (G′,H′) Red channel only. (I) Schematic drawing of a neuron (left) and a Müller cell (right) indicating the position of the centrosome (red dot) and the presumptive polarity of microtubules (blue lines). Asterisks indicate the vitreal (basal) surface of the retina; arrowheads indicate the OLM. Scale bars: 25 μm in A,B; 15 μm in C-F″; 10 μm in G-H′. EXPRESSION / LABELING:
PHENOTYPE:
|
|
Müller glia and photoreceptor phenotypes in ako and mok mutants. (A-D′) Confocal images of transverse cryosections through the retinae of mok (B,B′) and ako (D,D′) mutants at 4 dpf. Wild-type siblings of mutant animals are shown to the left (A,A′,C,C′). In all panels, Müller glia are labeled via the expression of the Tg(gfap:GFP) transgene (green). In addition, sections are stained with the Zpr-1 antibody to visualize double cones (red). Photoreceptor loss in akojj50 mutant retinae is more severe than in mokm632. At 4 dpf, the numbers of akojj50 and mokm632 mutant photoreceptors are reduced to 12% (n=46) and 26% (n=99) of the wild-type value (n=379), respectively. Wild-type Müller glia feature perikarya that localize to the vitreal half of the inner nuclear layer, and processes that span the entire thickness of the retina (A,A′,C,C′). In mokm632 mutants, many Müller glia maintain perikarya in the inner nuclear layer, and feature apical process at 4 dpf (B,B′). By contrast, in the akojj50 mutant, almost all glial perikarya are misplaced basally and the apical processes are largely absent (D,D′). A′,B′,C′,D′ present enlargements of the images shown to their left. In all panels, dorsal is up. L, lens. Scale bars: 40 μm in A-D; 8 μm in A′-D′). PHENOTYPE:
|
|
ako functions partially non-cell-autonomously in photoreceptor morphogenesis and survival. (A-C′) Confocal images of transverse cryosections through the retinae of mosaic animals. To generate genetic mosaics, blastomere transplantation was performed using the Tg(pax6-DF4:mCFPq01) transgenic ako line as the donor, and a non-transgenic line as the host. Sections were stained with an anti-GFP antibody to visualize donor-derived cells (red). Both wild-type (A,B,C) and mutant (A′,B′,C′) donor-derived cells contribute to the PRCL at 3.5 (A,A′), 4 (B,B′) and 6 dpf (C,C′), indicating a degree of non-cell-autonomy. The green signal in some panels is not relevant to this analysis and originates from a GFAP-GFP transgene. Scale bars: 15 μm. |
|
ako is supplied maternally. (A,A′) Control morpholino injection has no effect on development (A), whereas anti-ATG morpholino against the dynactin 2 gene results in a delayed epiboly (A′). In many embryos, yolk plug closure is not completed even at 12 hpf (white arrowheads in A′). (B,B′) By 24 hpf, the yolk is abnormally elongated, the tail region is severely stunted, and cell death appears to be abundant along the entire body axis of dynactin 2 morphants (B′, compare to control morpholino-treated embryos in B). (C,C′) Similarly, embryonic development shows severe defects in morphants at 30 hpf (C′, compare with C). (D,D′) These defects are rescued by ako mRNA injections at 30 hpf (D′, compare with D). (E) RT-PCR amplification of the ako transcript from control (CMO) and splice-site (SPMO) morpholino-treated embryos. Actin amplification is used as a control. In SP morpholino-treated embryos, ako mRNA can be efficiently amplified at 12 and 24 hpf, but not at 48 and 60 hpf, indicating the presence of maternally contributed transcript at early stages of embryogenesis. The transcript is detected again at 72 hpf, presumably because of a decrease of knockdown efficiency. PHENOTYPE:
|
|
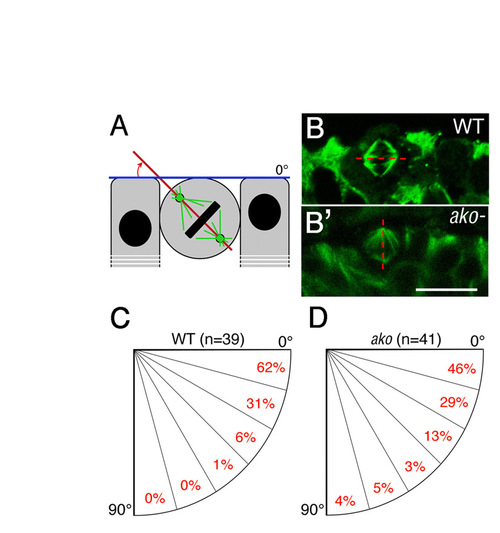
ale oko function in mitotic spindle orientation. (A) Schematic representation of mitotic spindle orientation relative to the apical surface of the retinal neuroepithelium. The angle between the spindle axis (red line) and the apical surface of the retinal neuroepithelium (blue line) was measured. (B,B′) Transverse sections through wild-type (B) and ako mutant (B′) neuroepithelia were stained with an anti-α-tubulin antibody to visualize mitotic spindles (green). Apical is up. (C,D) Quantification of spindle orientation in wild-type (C) and ako mutant (D) retinae. The alignment of the mitotic spindle is clearly less consistent in akojj50 retinae. Scale bar: 10 μm. PHENOTYPE:
|

Unillustrated author statements PHENOTYPE:
|


