- Title
-
Gsk3{beta}/PKA and Gli1 regulate the maintenance of neural progenitors at the midbrain-hindbrain boundary in concert with E(Spl) factor activity
- Authors
- Ninkovic, J., Stigloher, C., Lillesaar, C., and Bally-Cuif, L.
- Source
- Full text @ Development
|
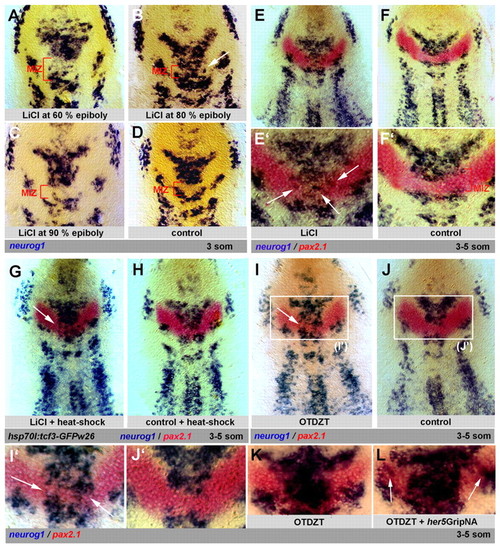
LiCl enhances neurogenesis in place of the IZ independently of canonical Wnt signaling and its effects are mimicked by Gsk3β inhibition. Zebrafish embryos analyzed at the 3- to 5-somite stage by in situ hybridization and flat-mounted, anterior up. (A-F′) Treatment with LiCl. At 80% epiboly (B,E,E′), treatment induces ectopic neurog1 expression in place of the MIZ (arrows in B,E′). LiCl posteriorizes the anterior neural plate when applied earlier (A), and is without effect when applied later (C). Bracket in A-D indicates the MIZ. (D,F,F′) Control. (G,H) Effect of LiCl applied at 80% epiboly (G, arrow) in transgenic hsp70l:tcf3-GFPw3 embryos expressing a dominant-negative Tcf3a upon heat shock. Expression of this transgene alone does not perturb IZ formation (H). (I-L) The Gsk3β inhibitor OTDZT triggers ectopic neurog1 expression in place of the MIZ (I,I′, compare with J,J′), and within the LIZ when Her5 activity is reduced by her5GripNA injection (L, arrows, compare with K). EXPRESSION / LABELING:
|
|
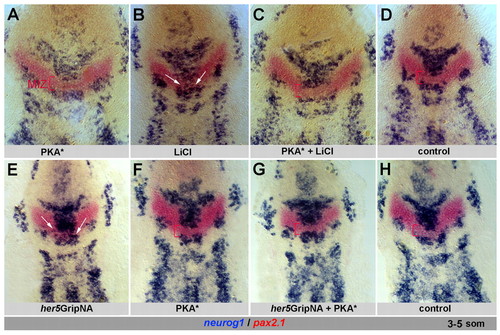
Activated PKA can compensate for reduced Gsk3β or E(Spl) activity to promote IZ formation. Zebrafish embryos analyzed at the 3- to 5-somite stage for neurog1 and pax2.1 and flat-mounted, anterior up. Bracket, MIZ; arrows indicate ectopic neurog1 expression. (A-D) Activated PKA (PKA*, injected as capped RNA at the one-cell stage) does not affect IZ formation (compare A with D, see also F) and blocks LiCl-induced neurog1 expression (arrows) across the MIZ (compare B with C). (E-H) Coinjection of PKA* RNA and her5GripNA (G) blocks the neurogenic effect of her5GripNA alone (E, arrows) and restores the MIZ. (H) Control. EXPRESSION / LABELING:
|
|
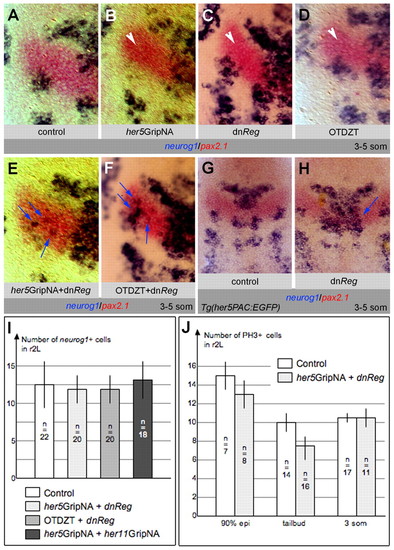
Activated PKA is required for IZ formation in cooperation with Gsk3β and E(Spl) activity. (A-H) Zebrafish embryos analyzed at the 3- to 5-somite stage for neurog1 and pax2.1 and flat-mounted, anterior up. (A-F) High magnifications of one half of the neural plate; blue arrows indicate ectopic neurog1 expression, white arrowheads indicate neurog1-free LIZ. (A-C,E) Expression of a dominant-negative form of PKA (dnReg) induces neurog1 expression across the MIZ (C), as occurs upon downregulating E(Spl) (B). Concomitant blockade of both pathways leads to ectopic LIZ neurog1 expression (E, compare with B,C). (D,F) Inhibiting Gsk3β or PKA activity with OTDZT leads to loss of the MIZ (C,D, see also Fig. 2K,K′), whereas co-inhibition also induces ectopic neurog1 expression within the LIZ (F). (G,H) The effect of blocking PKA remains unchanged in the Tg(her5PAC:EGFP) background (H, compare with C), in which one additional copy of the her11 gene is expressed. (I,J) The number of neurog1-expressing cells (I) and of cells in M phase (J) in the r2L domain is unchanged in embryos in which Her5 and PKA blockade triggers ectopic LIZ neurog1 expression (lightest gray boxes). In I, several other conditions triggering ectopic LIZ neurog1 expression are further compared (blockade of Gsk3β and PKA, medium gray box; blockade of Her5 and Him, dark gray box) with the same result. Bars indicate standard errors; n, the number of embryos analyzed. EXPRESSION / LABELING:
|
|
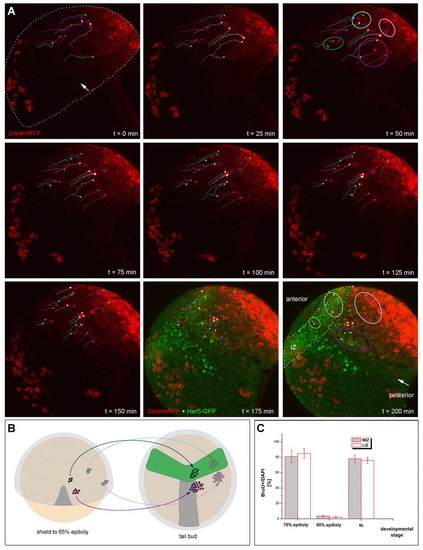
MIZ and LIZ cells differ in lineage but not in proliferation characteristics. (A) The origin of cells located within the MIZ (outlined in dark green), LIZ (outlined in pale green), r2M (outlined in purple) and r2L (outlined in pink) was tracked in live confocal movies. The cells were followed from shield (top left) to tailbud stage (bottom right) with membrane-localized 2xlckmRFP (red) in Tg(her5PAC:EGFP)ne1939 transgenic embryos. GFP (green) reveals the location of the IZ at tailbud stage (see t=175 and t=200 minutes). Confocal optical projections at 25-minute intervals, in which some tracked cells are identified with colored dots and lines. The same color is used for the same cell on each panel, and indicates the location of the cell at each time. The line indicates the path that will be followed by this cell to reach its final position at t=200 minutes. The tracking of individual cells shows that the four populations (MIZ, LIZ, r2M and r2L) maintain their relative positions throughout the movie. Landmarks: location of the notochord, white arrow; IZ, dots. Number of embryos analyzed is 4. The total number of cells tracked in the movie illustrated is 26. (B) Schematics illustrating the relative positions of the four cell populations (color-coded as above) at shield and tailbud stages. Dark gray, notochord; light gray, neuroectoderm; green, Tg(her5PAC:EGFP)ne1939 expression domain. (C) Comparison of cell cycle characteristics of MIZ and LIZ cells during the time of IZ formation. The percentage of cells incorporating BrdU among all MIZ or LIZ cells (DAPI) is identical at all stages. EXPRESSION / LABELING:
|
|
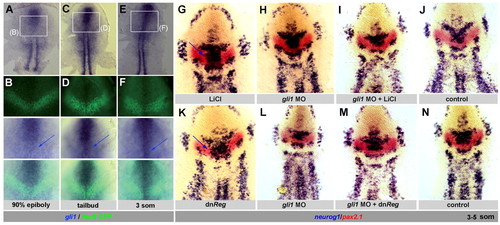
MIZ and LIZ cells differ in their expression of Gli1, which promotes neurogenesis and antagonizes PKA during IZ formation. (A-F) Expression of gli1 (blue) and Her5-GFP (green) in Tg(her5PAC:EGFP)ne1939 transgenic zebrafish embryos (flat-mounted, anterior up) shows that gli1 is transcribed at higher levels in the MIZ (arrows) than in the LIZ. B,D,F are high-magnification views of the boxed areas in A,C,E respectively, viewed sequentially (from top to bottom) under bright field, fluorescence and simultaneous bright field and fluorescence illumination. (G-N) Embryos analyzed at the 3- to 5-somite stage for neurog1 and pax2.1 (color-coded) and flat-mounted, anterior up. Blue arrows indicate ectopic neurog1 expression. (G-J) Blocking Gli1 activity does not affect IZ formation (H, compare with control J), but prevents the induction of neurog1 expression across the MIZ that is normally triggered by LiCl (I, compare with G). (K-N) Blocking Gli1 activity is sufficient to rescue the MIZ normally lost upon PKA downregulation (M, compare with K). (N) Control. EXPRESSION / LABELING:
|
|
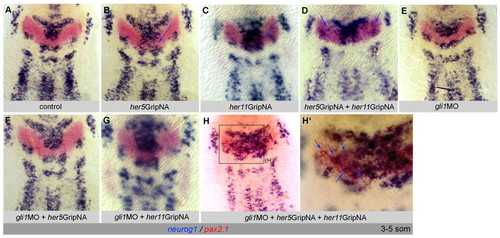
Gli1 accounts for the differential sensitivity of the MIZ and LIZ to E(Spl) neurogenesis inhibitors. (A-H′) Zebrafish embryos analyzed at the 3- to 5-somite stage for neurog1 and pax2.1 (color-coded) and flat-mounted, anterior up. Brackets, MIZ; blue arrows, ectopic neurog1 expression. In the absence of Gli1, which in itself has no effect on neurog1 expression (compare E with A), MIZ cells are unaffected by the loss of Her5 or Her11 (F,G, compare with B,C). MIZ and LIZ cells become concomitantly affected by a further downregulation of E(Spl) activity (loss of both Her5 and Her11), when they both upregulate neurog1, in an identical manner (H,H′, compare with D). EXPRESSION / LABELING:
|
|
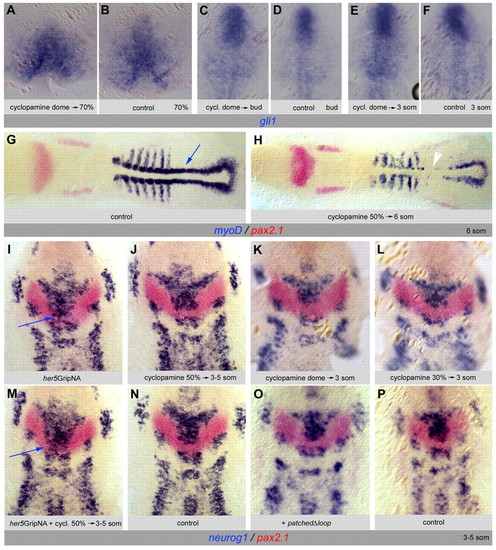
Gli1 expression and activity are not under the control of Hh signaling during IZ formation. (A-F) Expression of gli1 is unaffected upon cyclopamine (A,C,E) or mock treatment (B,D,F) applied between the dome stage and the stage of analysis [70% epiboly (A,B), tailbud (C,D) and 3 somites (E,F)]. (G,H) Expression of myoD (blue) and pax2.1 (red) on 6-somite zebrafish embryos (dorsal views, anterior left) upon cyclopamine treatment (H) as compared with mock treatment (G). The same cyclopamine concentration was used as in A,C,E; treatment between 50% epiboly and 6 somites. myoD is strongly decreased in adaxial cells (H, white arrowhead; compare with G, blue arrow). (I-N) Expression of neurog1 (blue) and pax2.1 (red) at the 3- to 5-somite stage (anterior up) is unaffected upon cyclopamine treatment applied at any stage between dome and 3-5 somites (J-L, compare with N). Cyclopmaine also does not rescue the effects of her5GripNA injections (M, compare with I), in contrast to the effect of blocking Gli1 activity (see Fig. 7F). (O,P) Expression of neurog1 (blue) and pax2.1 (red) at 3-5 somites is unaffected by blockade of Hh signaling via overexpression of PatchedΔloop (O, compare with control P). EXPRESSION / LABELING:
|

Unillustrated author statements |

