- Title
-
Characterization of retinoid-X receptor genes rxra, rxrba, rxrbb and rxrg during zebrafish development
- Authors
- Tallafuss, A., Hale, L.A., Yan, Y.L., Dudley, L., Eisen, J.S., and Postlethwait, J.H.
- Source
- Full text @ Gene Expr. Patterns
|
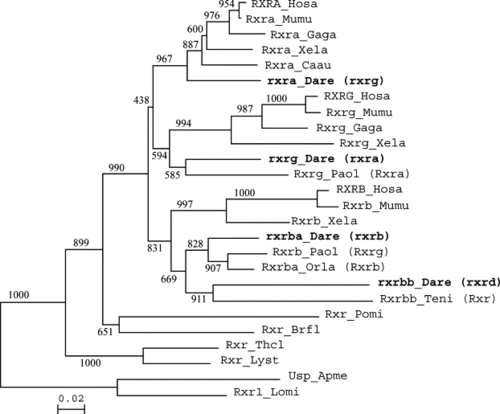
Phylogenetic analysis of retinoid-X receptor proteins. Amino acid sequences were aligned by Clustal-X and trimmed to include unambiguously aligned regions; phylogenetic analysis used the neighbor-joining method (Saitou and Nei, 1987). Numbers at nodes are bootstrap values out of 1000 runs. Alignments are available on request. Species abbreviations: Apme, Apis mellifera (honey bee); Brfl, Branchiostoma floridae (amphioxus); Caau, Carassius auratus (goldfish); Dare, Danio rerio (zebrafish); Gaga, Gallus gallus (chicken); Hosa, Homo sapiens (human); Lomi, Locusta migratoria (locust); Lyst, Lymnaea stagnalis (great pond snail); Mumu, Mus musculus (mouse); Orla, Oryzias latipes (medaka); Paol, Paralichthys olivaceus (flounder); Pomi, Polyandrocarpa misakiensis (an ascidian Urochordate); Teni, Tetraodon nigroviridis (pufferfish); Thcl, Thais clavigera (rock shell snail); Xela, Xenopus laevis (frog). Sequence accession numbers: RXRA_Hosa_AAH63827; Rxra_Mumu_NP_035435; Rxra_Gaga_XP_415426; Rxra_Xela_P51128; Rxra_Caau_AAO22211; rxra_Dare_NP_571228; RXRG_Hosa_NP_008848; Rxrg_Mumu_NP_033133; Rxrg_Gaga_NP_990625; Rxrg_Xela_P51129; Rxrg_Dare_AAH59576; Rxra_Paol_BAB71758; Hosa_CAI95622; Rxrb_Mumu_NP_035436; Rxrb_Xela_AAH72132; Rxrb_Dare_AAH54649; Rxrg_Paol_BAB71759; Rxrb_Orla_BAD93255; rxrd_Dare_NP_571313; Rxr_Teni_CAG12025; Rxr_Pomi_BAA82618; Rxr_Brfl_AAM46151; Rxr_Thcl_AAU12572; Rxr_Lyst_AAW34268; Usp_Apme_NP_001011634; Rxr1_Lomi_AAQ55293. |
|
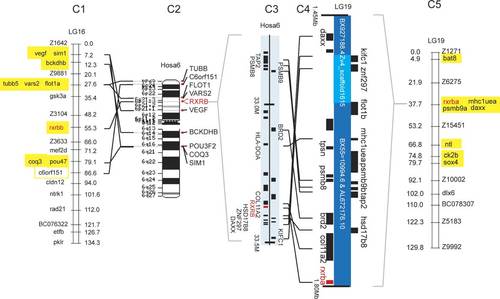
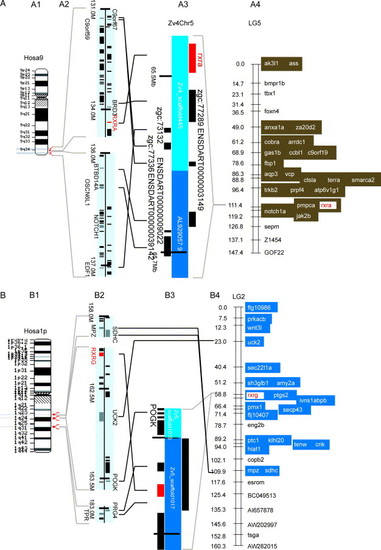
Genomic analysis of conserved syntenies for zebrafish rxr genes. (A) rxra (NP_571228). A1 shows human chromosome 9 with regions relevant to zebrafish rxra expanded in A2. The location of human genes and gene names are from NCBI Map Viewer (http://www.ncbi.nlm.nih.gov/mapview/map_search.cgi? ), with genes transcribed downwards shown on the right of the central line indicating the chromosome and genes transcribed upwards to the left of the line. A3 shows the rxra-containing region of the Zv4 zebrafish genome assembly (http://www.ensembl.org/Danio_rerio/), and A4 shows zebrafish linkage group 5 with loci orthologous to Hosa9 genes shown in brown (Woods et al., 2000). (B) rxrg (AAH59576). B1 shows Hosa1, and B2 shows relevant portions expanded. B3 is the portion of Zv5 containing rxrg, and B4 is LG2 with Hosa1 orthologs shown in blue. (C) RXRB co-orthologs. C1 and C5 show the duplicated zebrafish linkage groups containing rxrba and rxrbb, with Hosa6 orthologs indicated in yellow. C2 and C3 show the human chromosome and the region surrounding RXRB. C4 shows the portion of Zv4 containing rxrba. The rxrbb sequence was not assembled in Zv4 or Zv5. |
|
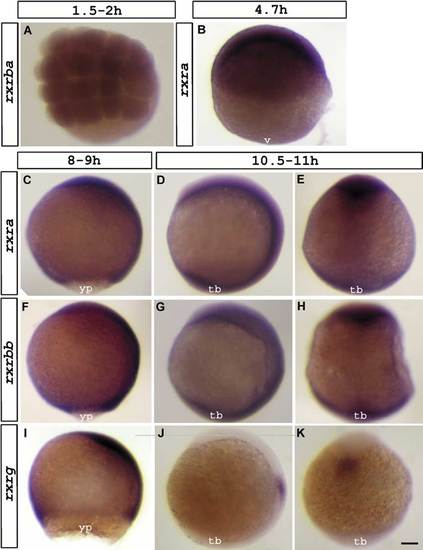
Expression of rxra (B, C-E), rxrba, (A), rxrbb (F-H) and rxrg (I-K) visualized at 1.5-2 hpf (A), 4.7 hpf (B), 8-9 hpf (C,F,I) and 10.5-11 hpf (D,E,G,H,J,K). Dorsal view (A,E,H,K). Lateral view; anterior up and dorsal to the left (B,C,D,F,G,I,J). Abbreviations: v, vegetal pole; yp, yolk plug; tb, tailbud. Scale bar represents 93 μm in A; 106 μm in B, C-K. EXPRESSION / LABELING:
|
|
Expression of rxra (A-E), rxrbb (F-J) and rxrg (K-O) at 12 hpf (A,F,K), 24 hpf (B,C,G,H,L,M) and 48 hpf (D,E,I,J,N,O). Refer to text for detailed descriptions. Flat-mount embryos seen from a dorsal view (A,C,E,F,H,J,K,M,O) or a lateral view (B,D,G,I,L,N). Anterior is to the left. Abbreviations: e, eye; fb, forebrain; hb, hindbrain; mb, midbrain; ncr, neural crest; phe, pharyngeal endoderm; ov, otic vesicle; sc, spinal cord; st, stomadeum; tb, tailbud; vph, ventral tissue in pharyngeal region. Scale bar represents 115 μm in 4A,F,K; 100 μm in 4B,G; 108 μm in 4L; 40 μm in 4C,M; 35 μm in 4H; 32 μm in 5D,E,I,J,N,O. EXPRESSION / LABELING:
|
|
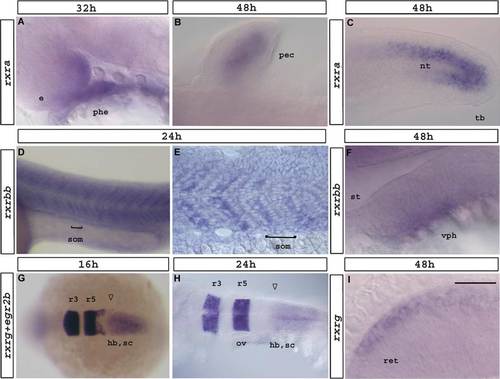
Expression of rxra (A–C), rxrbb (F,G,H) and rxrg (D,E,I). Refer to text for detailed descriptions. Flat-mount embryos seen from a dorsal view (B,G,H) or a lateral view (A,C–F,I). Anterior is to the left. (A) Magnified view of rxra expression in the anterior endoderm and the eye at 32 hpf. (B) rxra pectoral fin bud expression at 48 hpf. (C) rxra tail expression at 48 hpf. (D,E) Stripes of rxrbb expression at 24 hpf in somites. Higher magnification view of somites. Bar in (D,E) marks the boundary from one somite to the next. (E) Sagittal section. (F) rxrbb expression in the ventral head tissue at 48 hpf. (G,H) Dorsal view of a whole-mount embryo. rxrg and egr2b expression at 16 hpf (G) and 24 hpf (H). Arrow in (G,H) marks anterior border of rxrg expression. (I) Magnified view of rxrg expression in the eye at 48 hpf. Abbreviations: e, eye; ov, otic vesicle; pec, pectoral fin bud; hb, hindbrain; nt, notochord; r3, rhombomere 3; r5, rhombomere 5; ret, retina; sc, spinal cord; st, stomadeum; tb, tailbud; vph, ventral tissue in pharyngeal region. Scale bar represents 60 μm in 5A; 27 μm in 5B; 63 μm in 5C; 135 μm in 5D; 48 μm in 5E; 23 μm in 5F; 159 μm in 5G; 119 μm in 5H; 19 μm in 5I. EXPRESSION / LABELING:
|

Unillustrated author statements EXPRESSION / LABELING:
|
Reprinted from Gene expression patterns : GEP, 6(5), Tallafuss, A., Hale, L.A., Yan, Y.L., Dudley, L., Eisen, J.S., and Postlethwait, J.H., Characterization of retinoid-X receptor genes rxra, rxrba, rxrbb and rxrg during zebrafish development, 556-565, Copyright (2006) with permission from Elsevier. Full text @ Gene Expr. Patterns

