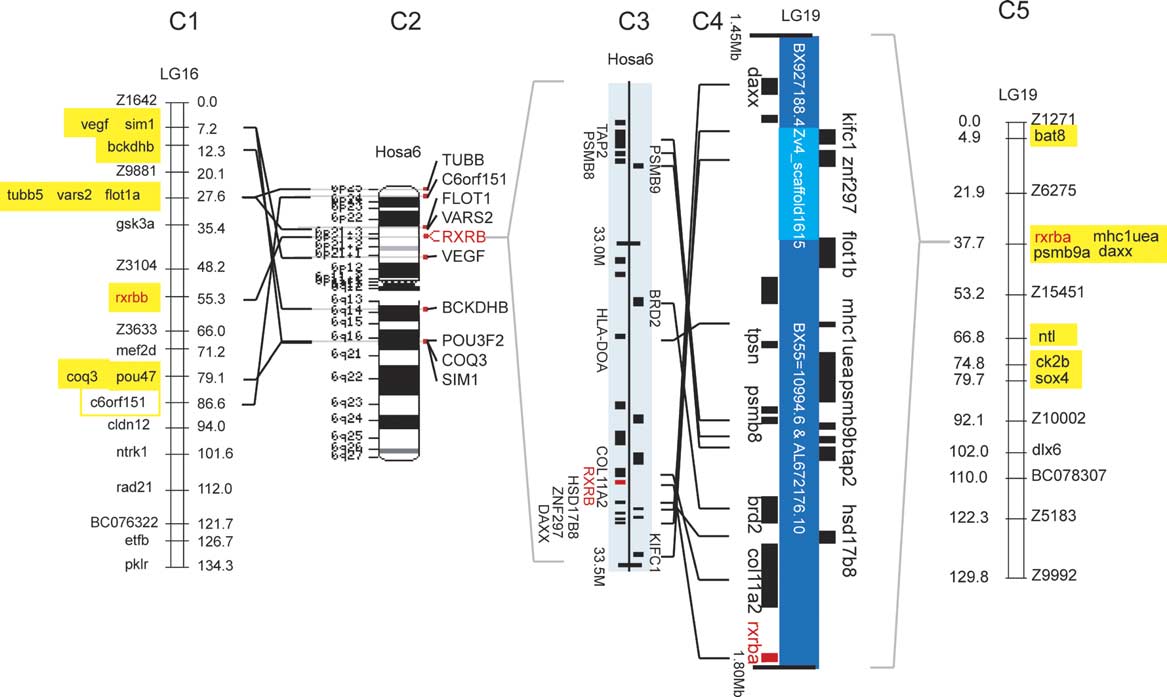
Fig. 2 Genomic analysis of conserved syntenies for zebrafish rxr genes. (A) rxra (NP_571228). A1 shows human chromosome 9 with regions relevant to zebrafish rxra expanded in A2. The location of human genes and gene names are from NCBI Map Viewer (http://www.ncbi.nlm.nih.gov/mapview/map_search.cgi? ), with genes transcribed downwards shown on the right of the central line indicating the chromosome and genes transcribed upwards to the left of the line. A3 shows the rxra-containing region of the Zv4 zebrafish genome assembly (http://www.ensembl.org/Danio_rerio/), and A4 shows zebrafish linkage group 5 with loci orthologous to Hosa9 genes shown in brown (Woods et al., 2000). (B) rxrg (AAH59576). B1 shows Hosa1, and B2 shows relevant portions expanded. B3 is the portion of Zv5 containing rxrg, and B4 is LG2 with Hosa1 orthologs shown in blue. (C) RXRB co-orthologs. C1 and C5 show the duplicated zebrafish linkage groups containing rxrba and rxrbb, with Hosa6 orthologs indicated in yellow. C2 and C3 show the human chromosome and the region surrounding RXRB. C4 shows the portion of Zv4 containing rxrba. The rxrbb sequence was not assembled in Zv4 or Zv5.
Reprinted from Gene expression patterns : GEP, 6(5), Tallafuss, A., Hale, L.A., Yan, Y.L., Dudley, L., Eisen, J.S., and Postlethwait, J.H., Characterization of retinoid-X receptor genes rxra, rxrba, rxrbb and rxrg during zebrafish development, 556-565, Copyright (2006) with permission from Elsevier. Full text @ Gene Expr. Patterns

