IMAGE

Figure 3

ID
ZDB-IMAGE-221214-178
Source
Figures for Poudel et al., 2022
Image
Figure Caption

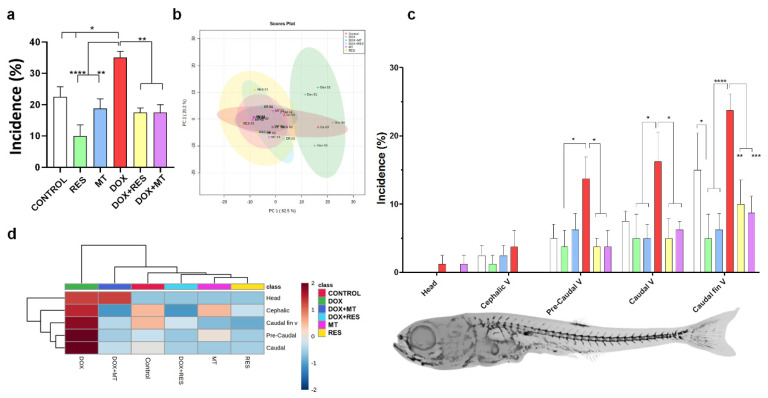
Figure 3

Incidence and distribution of skeletal deformities. Incidence of skeletal deformities (a). Partial Least-Squares Discriminant Analysis (PLS-DA score) on the incidence of deformities of zebrafish supplemented with antioxidants, resveratrol (RES), MitoTEMPO (MT), and pro-oxidant, doxorubicin (DOX) (b). Distribution of skeletal deformities (c) and heatmap of distribution of skeletal deformities (d). Statistical significances were calculated using Tukey’s multiple comparisons (one-way ANOVA) [* p ≤ 0.05, ** p ≤ 0.01, *** p ≤ 0.001, **** p ≤ 0.0001] [N = 20 × 4].

Figure Data
Acknowledgments
This image is the copyrighted work of the attributed author or publisher, and ZFIN has permission only to display this image to its users. Additional permissions should be obtained from the applicable author or publisher of the image. Full text @ Nutrients