
Fig. 2
|
Fig. 2
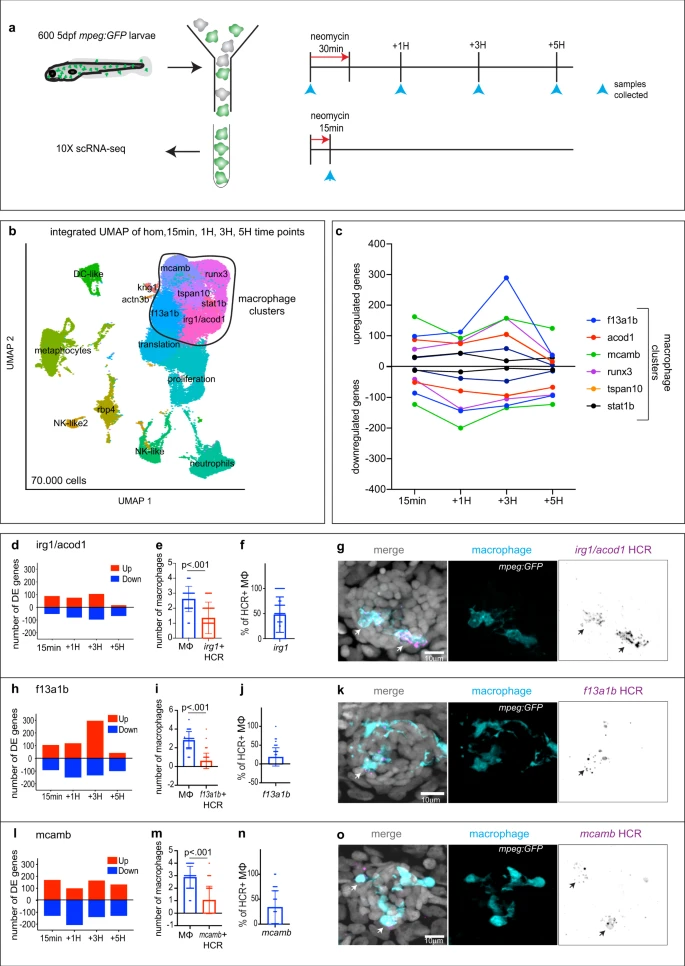
a Schematics of neomycin regime and time points collection for scRNA-seq. b Integrated UMAP of the five time points (1 experiment per time point). Cluster names are labeled on the UMAP. Macrophage clusters are circled. c Quantification of genes differentially up- and downregulated at each time point within the macrophages clusters. d, h, l Quantification of genes differentially up- and downregulated at each time point for (d) the ‘irg1/acod1’, (h) ‘f13a1b’ and (l) ‘mcamb’ clusters. e, i, m Quantifications of effector macrophages (MΦ) that either express (e) irg1/acod1, (i) f13a1b or (m) mcamb by HCR at 1H. Each dot represents the number of macrophages per neuromast (5 neuromasts per larvae, 16 larvae and 3 biological replicates). P-values represent non-parametric two-tailed Student’s t-test. f, j, n Quantifications of the percentage of HCR + effector macrophages (MΦ) in the (f) irg1/acod1, (j) f13a1b and (n) mcamb clusters. Each dot represents the number of effector macrophages per neuromast (5 neuromasts per larvae, 16 larvae and 3 biological replicates). g, k, o Representative confocal images (projection of a 30 μm z-stack) of HCR-FISH (arrows) within the effector macrophages for (g) irg1/acod1, (k) f13a1b and (o) mcamb (from 5 neuromasts per larvae, 16 larvae and 3 biological replicates). For all graphs, data are represented as mean ± SD.