IMAGE

Figure 3

ID
ZDB-IMAGE-210825-41
Source
Figures for Dray et al., 2021
Image
Figure Caption

Figure 3

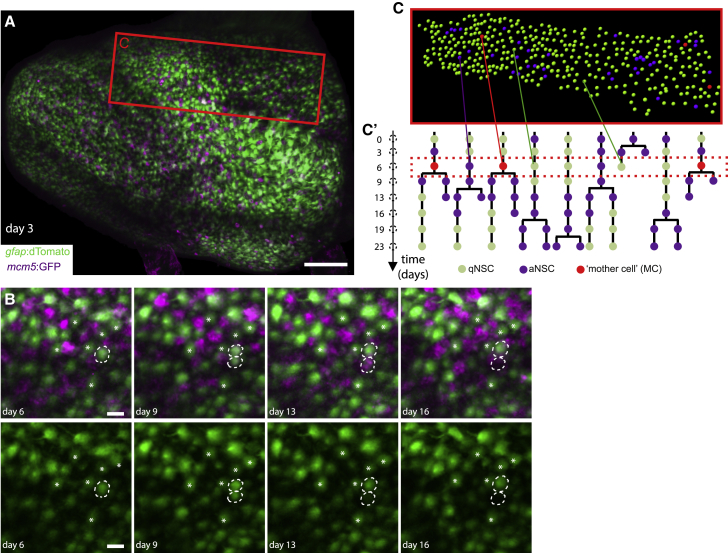
Intravital imaging resolves adult NSC lineage trees in time and space

(A) Whole pallial hemisphere imaged intravitally in a 3mpf casper;Tg(gfap:dTomato);Tg(mcm5:GFP) fish (named Mimi) (anterior left, tile of 4 images with 10% overlap, taken at day 3 from a 35-day session of recordings every 3–4 days, 8 time points). Colors of the live reporters were adjusted (green: NSCs, magenta: proliferating cells).

(B) Close-ups from the same video showing an asymmetric NSC division (dotted circles) between days 3 and 9: 1 daughter differentiates over the next 7 days (bottom dotted circle, loss of the gfap:dTomato signal). White asterisks: random qNSCs close to the division, used for alignment.

(C and C’) Segmentation and NSC tracking over 23 days in Dm in Mimi. (C) Segmentation of ~390 cells per time point (area boxed in A, at day 6). (C’) Example of dividing tracks, with cell states (color-coded) and the spatial position of each tree (see also Figure S5A). Scale bars: (A), 100 μm; (B), 20 μm.

Acknowledgments
This image is the copyrighted work of the attributed author or publisher, and ZFIN has permission only to display this image to its users. Additional permissions should be obtained from the applicable author or publisher of the image. Full text @ Cell Stem Cell