IMAGE

Fig. 3

ID
ZDB-IMAGE-210508-18
Genes
Source
Figures for Laquatra et al., 2021
Image
Figure Caption

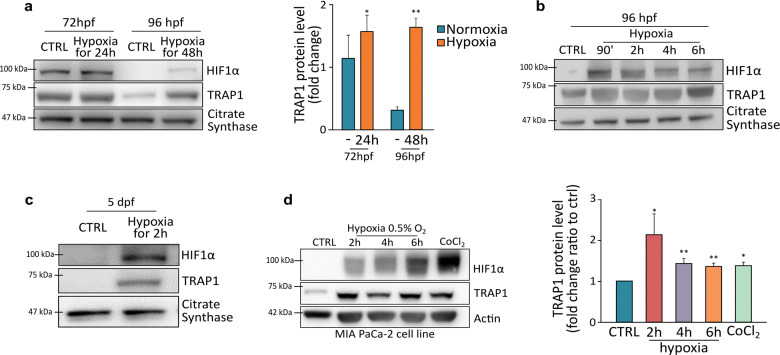
Fig. 3 TRAP1 is induced following hypoxia.

a Western blot analysis (left) and protein quantification (right) of TRAP1 expression level in embryos exposed to hypoxia (5% O2) from the stage of 48 hpf for 24 and 48 h. b TRAP1 expression profile was analyzed at 96 hpf following short-term hypoxia treatment as indicated. c Western blot analysis of TRAP1 expression in Zebrafish at 5 dpf following short-term hypoxia treatment. d Western blot analysis and quantification of TRAP1 expression in MIA PaCa-2 human pancreatic adenocarcinoma cells following 2–6 h of hypoxia (0.5% O2) or treatment with CoCl2 (0.5 mM for 6 h). The mitochondrial protein citrate synthase and actin were used as loading controls for fish and human cells, respectively. Data are reported as average ±SEM of at least three independent experiments with an unpaired two-tailed Student’s t test; asterisks indicate significant differences (*p < 0.05, **p < 0.01, ***p < 0.001).

Figure Data
Acknowledgments
This image is the copyrighted work of the attributed author or publisher, and ZFIN has permission only to display this image to its users. Additional permissions should be obtained from the applicable author or publisher of the image. Full text @ Cell Death Dis.