IMAGE

Fig. 1

ID
ZDB-IMAGE-200406-27
Source
Figures for Mikalsen et al., 2020
Image
Figure Caption

Fig. 1

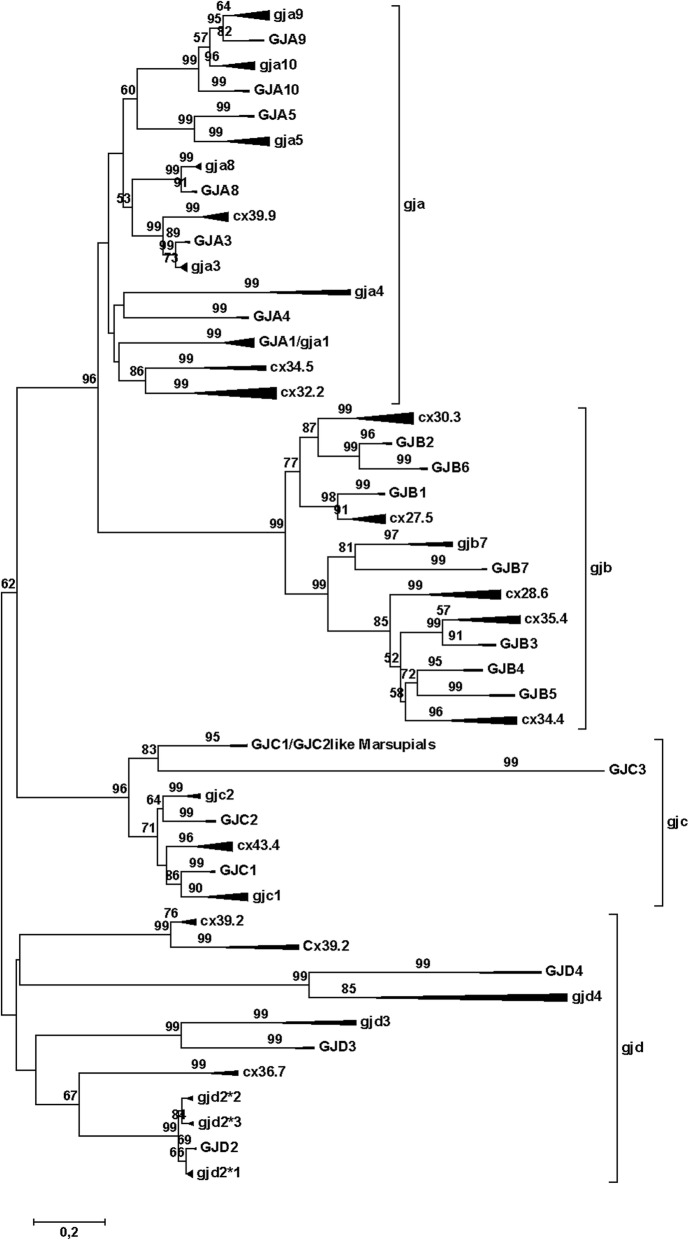
Phylogenetic tree for the gap junction protein (connexin) gene family. The mammalian branches are indicated by upper case letters; teleost branches are indicated by lower case letters. The width of the triangles indicates the number of taxa included in the branch, and the length of the triangles indicates the sequence variation within the branch. The tree was made by the Minimum Evolution method, using amino acids (354 amino acid sequences with 201 positions in the final dataset) and the Dayhoff substitution matrix. The bootstrap values (500 replicates) > 50% are shown next to the branches. To avoid disruptive long-branch attraction, some sequences were excluded (see text). This model gives results that are quite close to the majority of results as summed up in Suppl. Table 1, and thus is close to an average tree from all the phylogenetic analyses. The major difference is that the mammalian GJA10 and teleost gja10 have switched places. In the original three, the root of the GJD family splits up in three very close branches, but using the rooting function in the Mega Tree Explorer, they were collected them into one common basal branch. Note the commonly occurring dichotomy with the mammalian sequences in one of the sub-branches and the teleost sequences in the other sub-branch, although some of the teleost groups do not have a mammalian counterpart (and vice versa). The scale bar (lower left) indicates the number of amino acid substitutions per site

Acknowledgments
This image is the copyrighted work of the attributed author or publisher, and ZFIN has permission only to display this image to its users. Additional permissions should be obtained from the applicable author or publisher of the image. Full text @ BMC Genomics