Fig. 2
Fig. 2
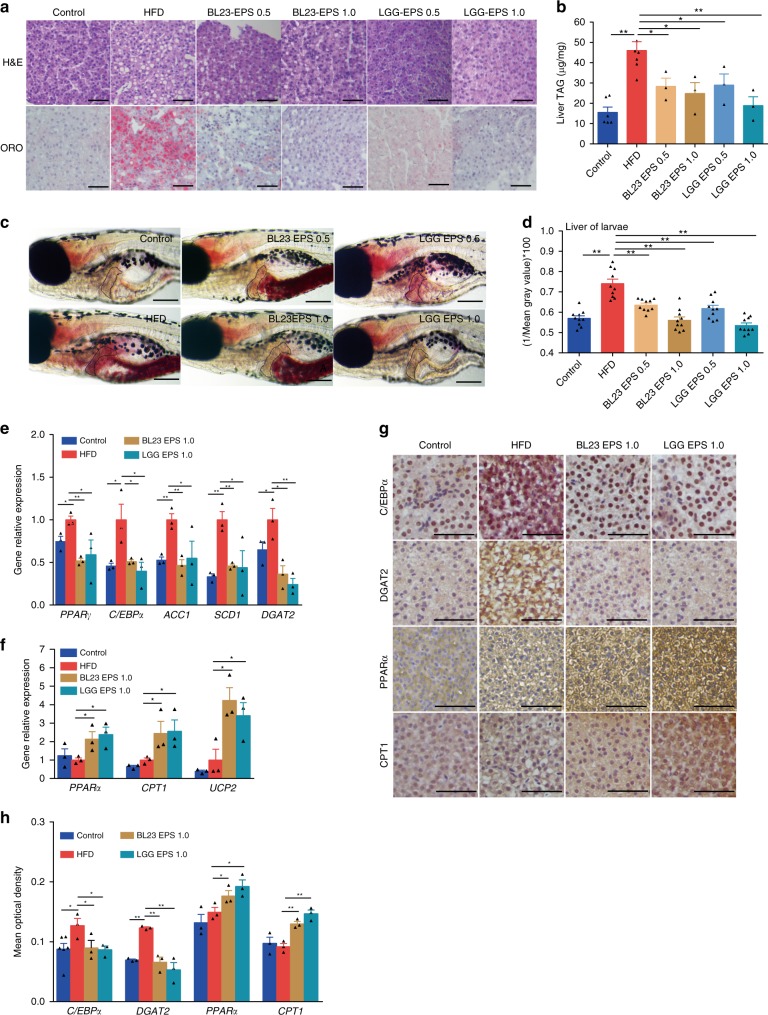
LGG EPS and BL23 EPS ameliorated the hepatic steatosis in high-fat diet-fed zebrafish. Adult zebrafish (1-month-old) were fed with the control diet, HF diet, or HF diet supplemented with 0.5% or 1% EPS for 4 weeks. a Representative liver histology images with oil red O staining and H&E staining. The scale bar is 50 μm. b Triacylglyceride contents in the liver (n = 3 or 6, pool of three zebrafish per sample). c Representative images of whole-mount oil red O staining of larvae fed control diet, high-fat diet, or high-fat diet supplemented with 0.5 or 1% EPS for one week. The scale bar is 200 μm. d Quantitative evaluation of hepatic steatosis in zebrafish larvae fed control diet, high-fat diet, or high-fat diet supplemented with 0.5 or 1% EPS for one week (n = 10). The ORO images in panel c were converted to 8-bit gray scale, and mean gray value was measured using ImageJ software to quantitatively evaluate hepatic steatosis. The expression of genes related to lipogenesis (e), energy expenditure (f), in livers as measured by q-PCR (n = 3, pool of three zebrafish per sample). g, h Immunohistochemical analysis and quantification of hepatic C/EBPα, DGAT2, PPARα, and CPT1 levels, the scale bar is 50 μm. Data were expressed as the mean ± SEM. Differences are considered significant at P < 0.05 (*) and P < 0.01 (**)

