Fig. 6
Fig. 6
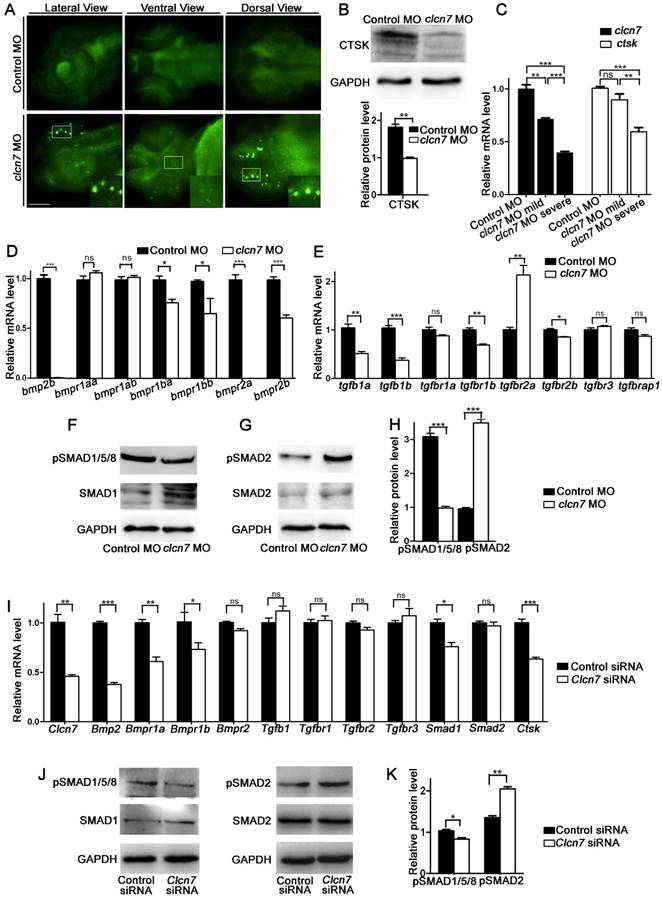
clcn7 deficiency led to lysosomal storage, reduced Cathepsin K expression and imbalanced TGF-β/BMP signaling pathway. (A) LysoTracker staining revealed lysosomal storage in the brain and jaw in clcn7 morphants at 3dpf compared to control morphants. The insets showed higher magnification of the white boxed areas in clcn7morphants. (B) Western blot and quantification analysis showed that CTSK protein was markedly decreased in clcn7morphants at 3dpf. (C) Comparison of clcn7 and ctsk level using Q-PCR detection. The mRNA level of clcn7 and ctskshowed a dose-dependent parallel downregulation with severe craniofacial changes. (D, E) Q-PCR analysis results. Transcript levels of bmp2b and bmpr1ba, bmpr1bb, bmpr2a, bmpr2b were decreased, the levels of tgfb1a, tgfb1bwere declined and that of tgfbr2a was increased in clcn7 morphants compared to controls at 3dpf. (F, G and H)Western blots results. The protein levels of pSMAD1/5/8 proteins were significantly reduced, while pSMAD2 levels were increased compared to control. (I) Q-PCR results of BMSCs. Compared to controls, the transcript levels of Bmp2 and Bmpr1a, Bmpr1b, Smad1 and Ctsk were decreased in Clcn7 siRNA group. (J, K) Western blot analysis showed that Clcn7 siRNA increased the protein levels of pSMAD2, while pSMAD1/5/8 levels were reduced compared to controls. For B-H: Control MO n=50, clcn7 MO n=50, clcn7 MO mild n=50, clcn7 MO severe n=50. All data represent mean ±SD. The experiment was repeated at least thrice with the same conditions. ns: not significant difference. * p<0.05, ** p<0.01, *** p<0.001. Scale bars: 100 μm.

