
|
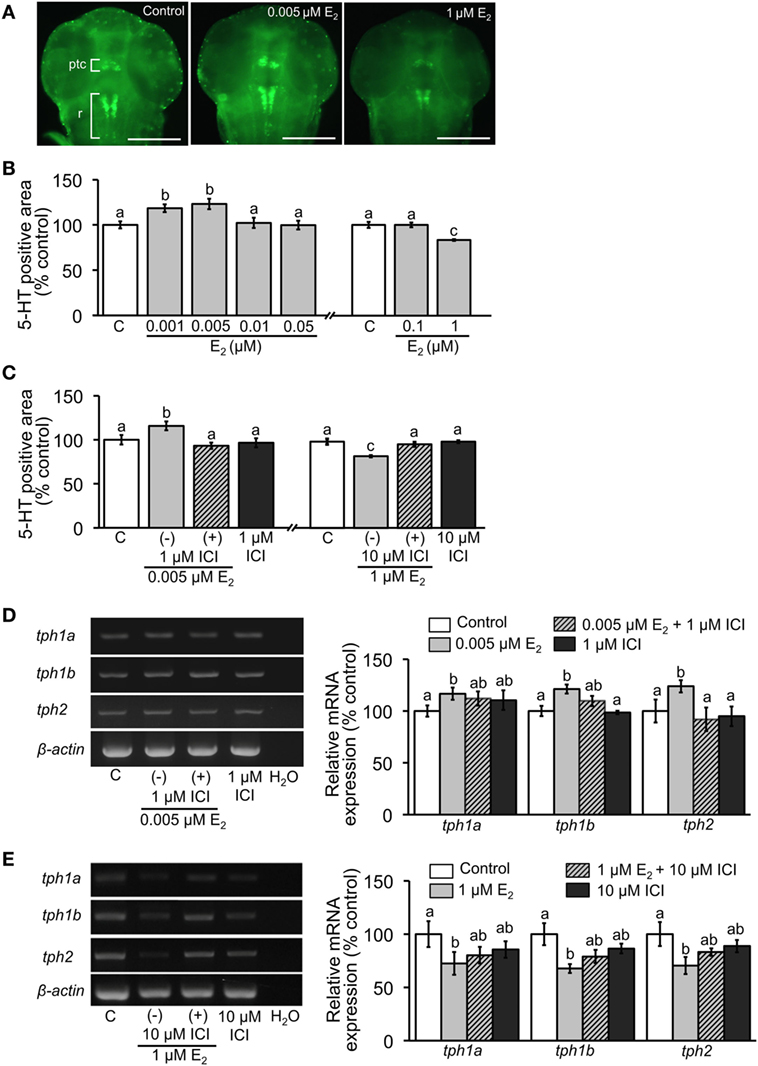
Fig. 1
Effect of E2 on 5-HT-positive area and relative expression of tph isoforms. (A) Representative images of ventral view of head region showing 5-HT-positive cells in pretectal and thalamic complex (ptc) and raphe (r) at 2 dpf. Scale bar: 200 µm. (B,C) Measurements of the area of 5-HT-positive neurons in the experiment of E2 exposure and co-incubation of E2 and ICI, respectively. (D,E) Semi-quantitative PCR for expression of tph isoforms in 4 dpf larvae in the experiments of exposure to low and high doses of E2 and co-incubation with ICI, respectively. Data are presented as a mean ± SEM. Different letters in each graph indicate significant differences (p < 0.05).