Fig. 3
Fig. 3
Validation and Spatial Distribution of 10 Novel Habenular Neuronal Types
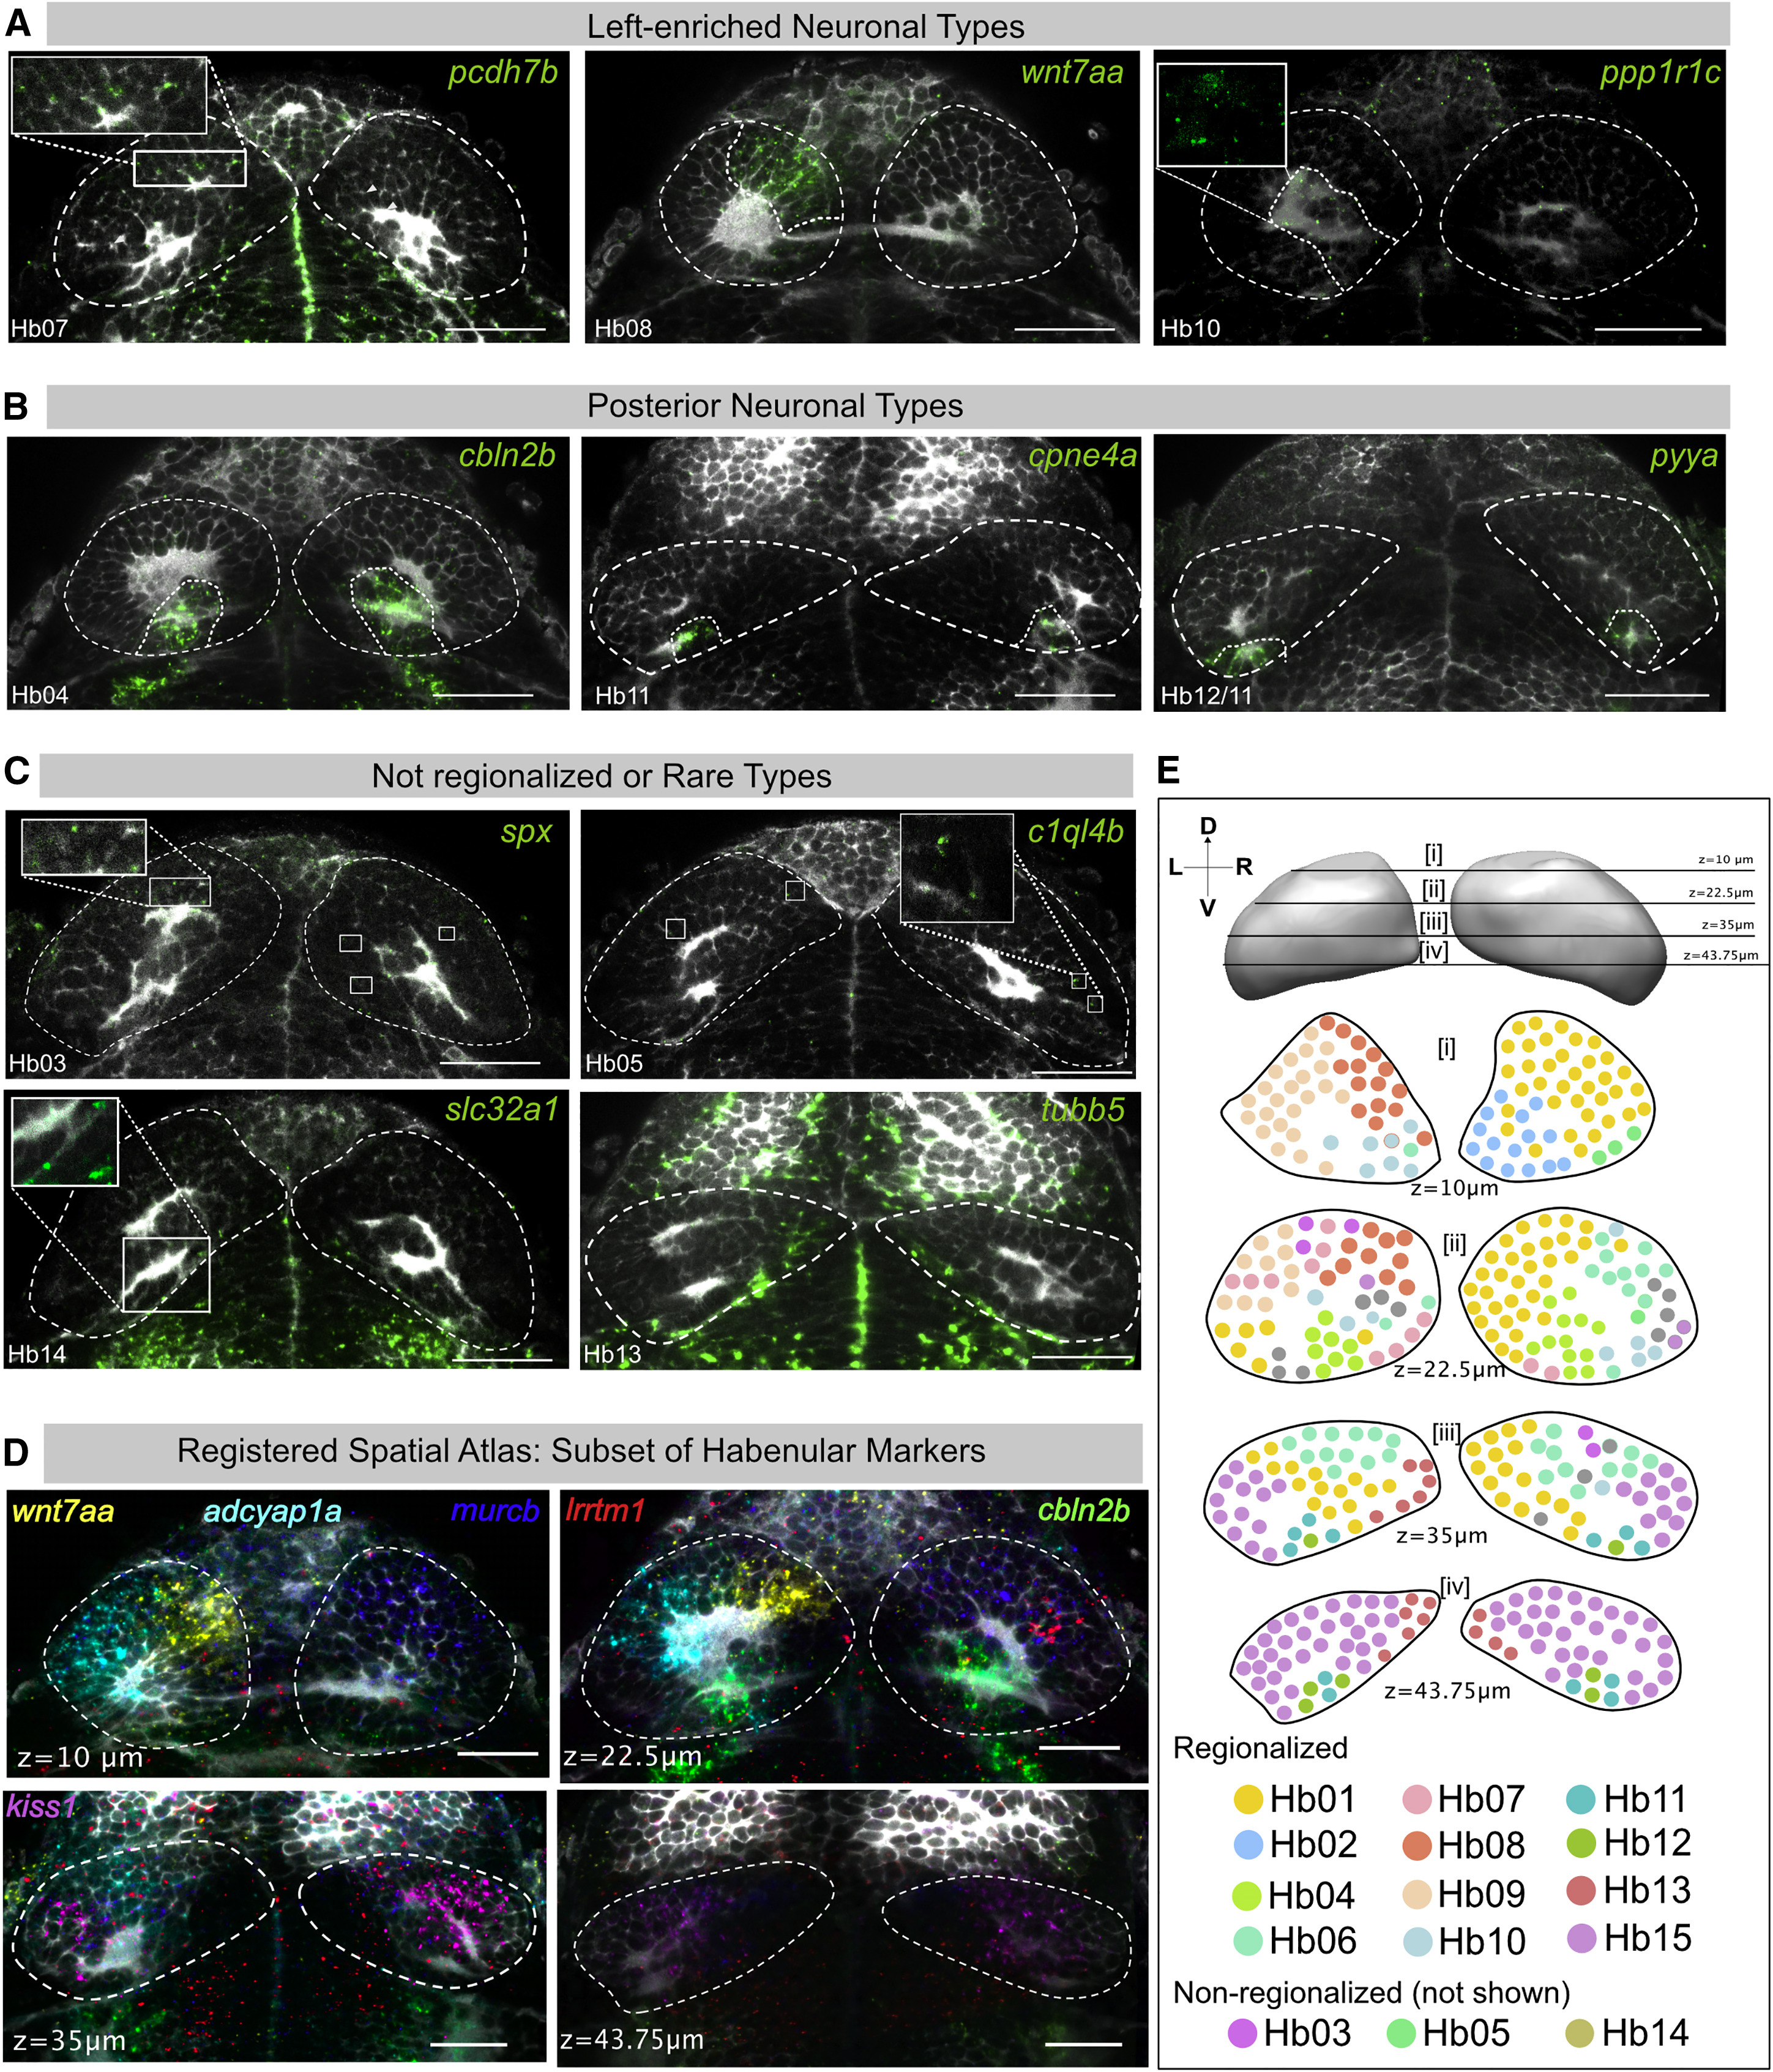
(A–C) RNA-FISH (green) was performed for specific markers for novel clusters. (A) Left-enriched clusters: Hb07 (pcdh7b), Hb08 (wnt7aa), Hb10 (ppp1r1c); (B) posterior habenular clusters: Hb04 (cbln2b), Hb11 (cpne4a), Hb12/11 (pyya); (C) non-regionalized or rare neuronal types: Hb03 (spx), Hb05 (c1ql4b), Hb14 (slc32a1), and Hb13 (tubb5), each overlaid with a total-Erk co-stain (pale gray) for registration. In each case, representative habenular slices with expression are shown. Full stacks are available through a linked website (see Data and Software Availability).
(D) Slices through the registered reference habenula simultaneously showing six marker genes that are expressed in a regionalized pattern: wnt7aa (La_Hb08), adcyap1a (La_Hb07), cbln2b (La_Hb04), murcb (La_Hb01), lrrtm1 (La_Hb06), gpr139 (La_Hb15).
(E) Schematic of representative transverse slices through the habenula displaying rough spatial co-ordinates of previously described as well as new neuronal types found by single-cell analysis. Cells are color coded based on their identity in the t-SNE plot (see Figure 1C). Depth is indicated by the z slice in microns. The sectioning extends from z = 0 μm (dorsal) and z = 75 μm (ventral). Only regionalized markers are represented. Schematic is a simplified representation of an accompanying stack of registered habenular markers overlaid onto one another (see Movie S1). Scale bars indicate 50 μm.
See also Figure S3, Table S1, and Movie S1.

