
|
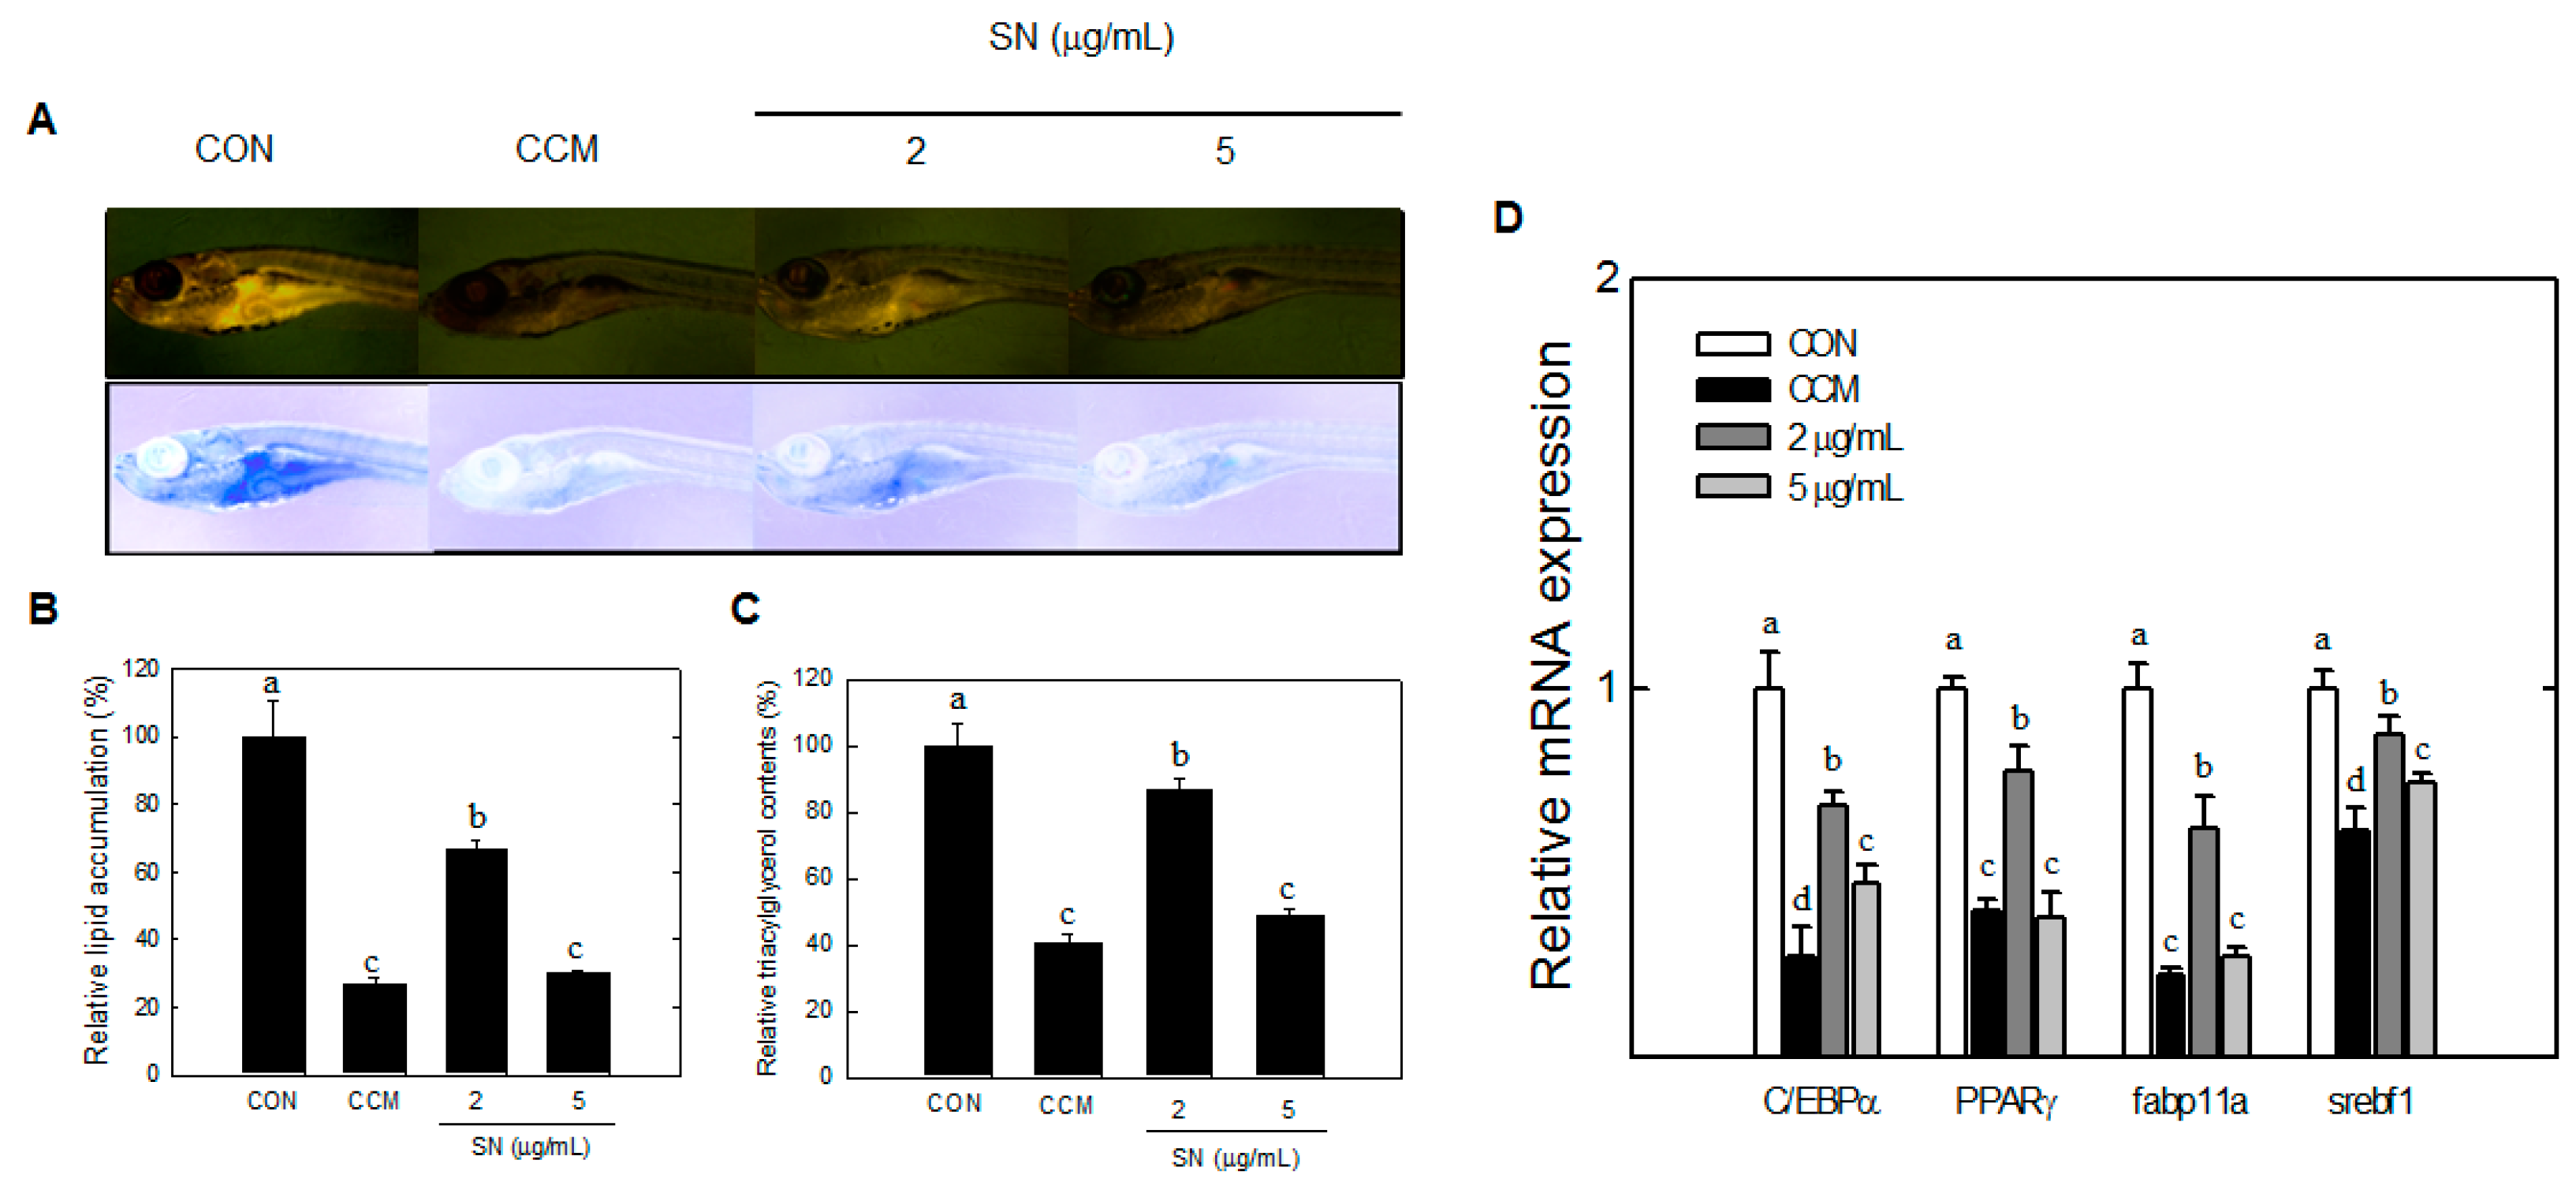
Fig. 8
Effects of SN on lipid accumulation in zebrafish. (A) Live larvae were visualized under a fluorescence microscope, and the image color was inverted; (B) Fluorescence microscopy image were quantified by using ImageJ software; (C) Triglyceride levels in zebrafish were determined using a TG Assay Kit (Zen Bio, Inc.); (D) mRNA expression of adipogenic factors in zebrafish was quantified by qRT-PCR. CON: high fat diet, CCM: curcumin, SN: seapolynol. Data are presented as means ± SD of 20 zebrafish. All data are representative of three replicates. Means not designated by a common superscript are significantly different (p < 0.05).