
Fig. 5
|
Fig. 5
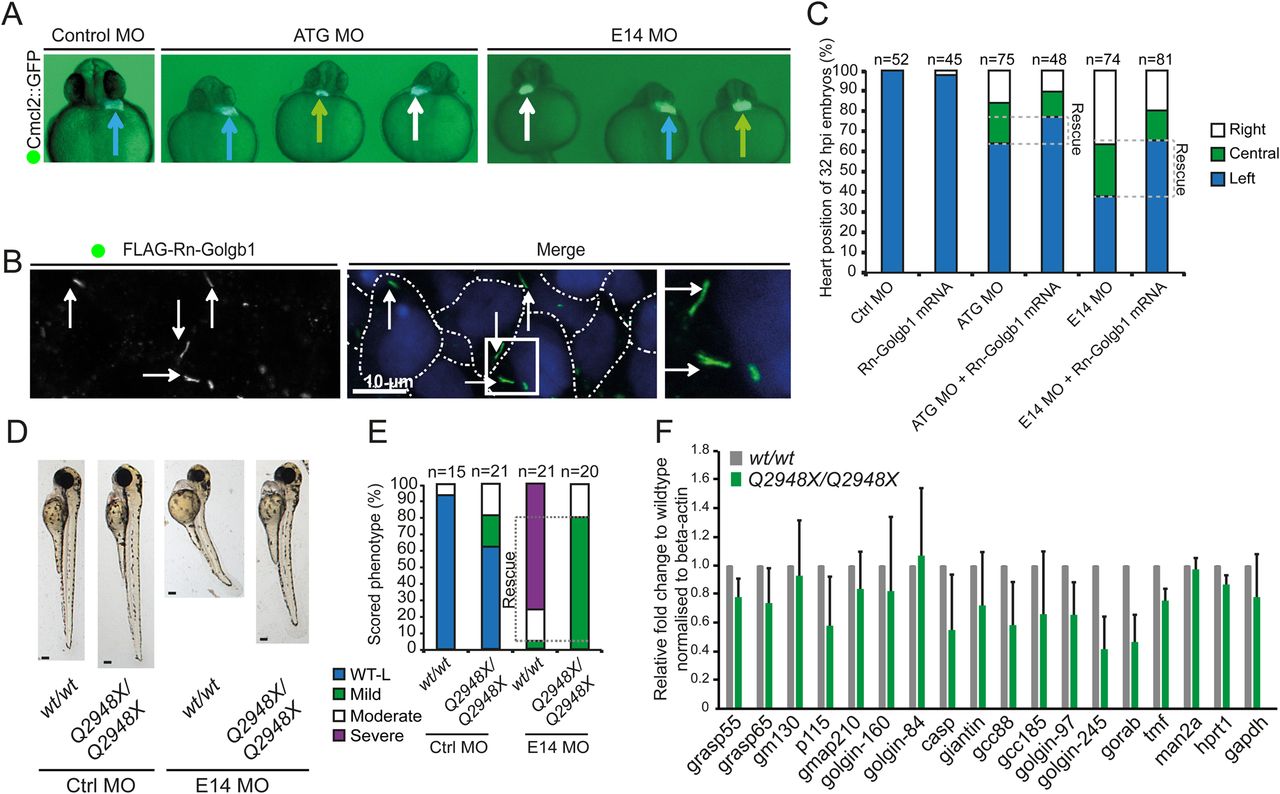
Left-right asymmetry and phenotypic rescue of giantin MO. (A) Cardiomyocyte Cmcl2::GFP transgenic reporter line outlining the heart position (arrows, blue: left; green: midline; white: right) at 32 hpf. (B) Representative confocal image of 48 hpf with ATG morpholino and Rn-Golgb1 mRNA showing Golgi localisation of Rn-Golgb1 in dermal cells stained for anti-flag (white arrows). White dotted line indicates cell boundaries. N=3 individuals. (C) Quantification of heart position (32 hpf), additionally showing Rn-Golgb1 mRNA co-injection rescue. (D) Stereomicroscope images of 3 dpf control and E14 morpholinos injected with same dose in WT and golgb1Q2948X/Q2948X individuals derived from same day WTxWT and golgb1Q2948X/Q2948X x golgb1Q2948X/Q2948X in-crosses with (E) quantification of phenotypes scored. (F) Quantitative RT-PCR of golgins showing relative mRNA expression levels on 5 dpf larvae. Normalised to beta-actin, mean and standard deviation. All data from three independent experiments.