
|
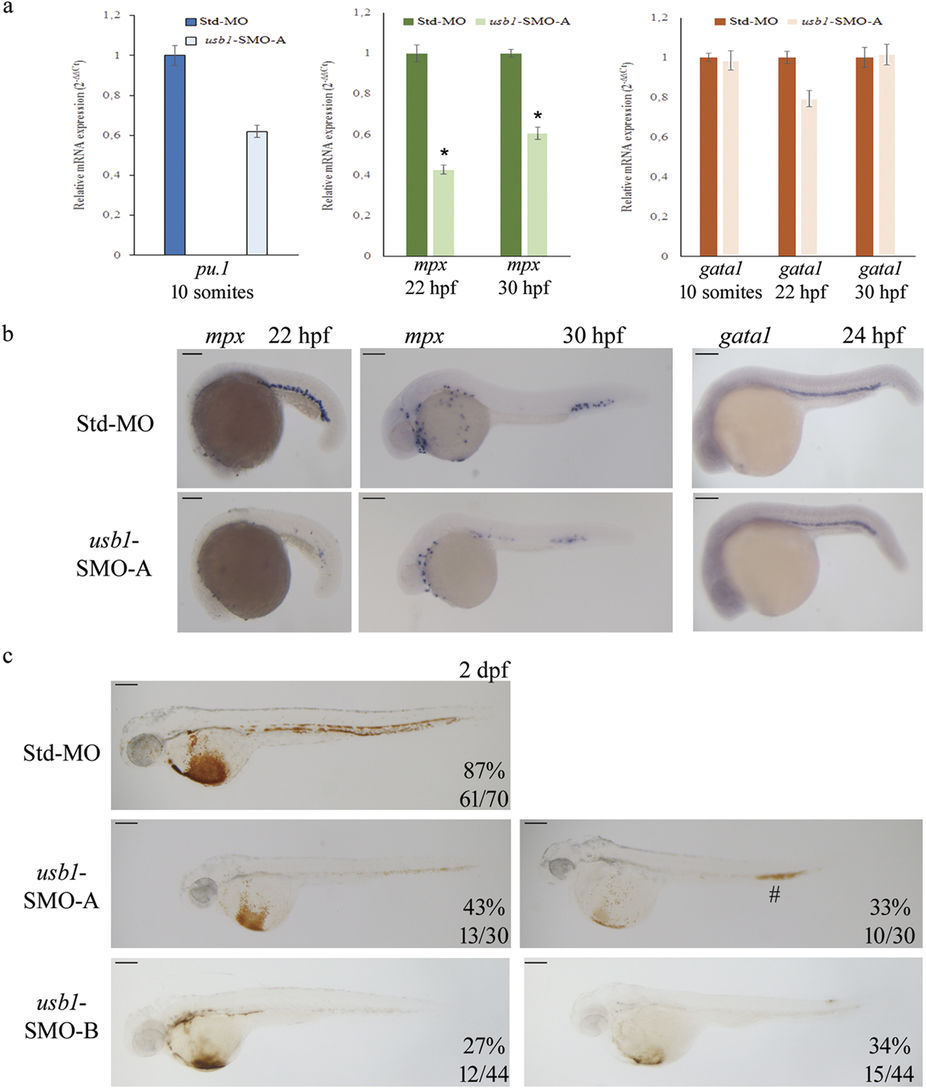
Fig. 5
Effect of usb1 knockdown on haematopoiesis.
(a) Real-time PCR analysis of pu.1, gata1 and mpx expression at the indicated developmental stages of embryos injected with SMO-A or Std-MO (each at 0.6 pmol/embryo). Samples were run in triplicate and data are expressed as the mean ± standard deviation. Asterisks (*) indicate statistically significant differences (t- test; p < 0.05). (b) WISH of gata1 and mpx in SMO-A and control embryos at the indicated developmental stages. (c) O-dianisidine staining for haemoglobin in embryos injected with Std-MO (top), SMO-A (central) and SMO-B (bottom panels) (each at 0.6 pmol/embryo). The left and the right images are representative of the slight and severe erythropoiesis defects observed at the indicated percentages in SMO-A- and SMO-B-injected embryos. The # points to the caudal region of the morphant where the accumulation of blood is observed. Scale bars: (b,c) 200 μm.