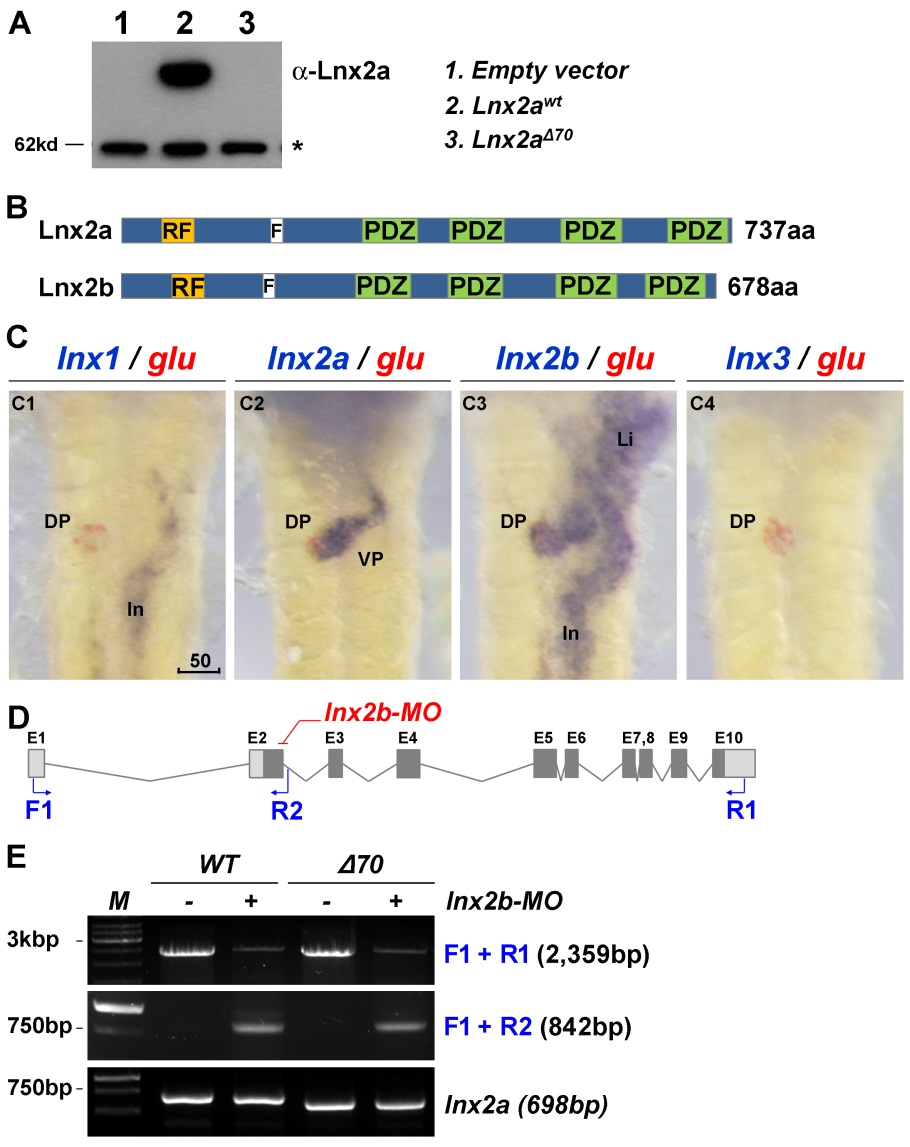
Fig. S3 Comparison of lnx2a and lnx2b genes in pancreas development. (A) The lnx2aΔ70 mutant does not produce Lnx2a protein. 293T cells were transfected with empty vector or expression vectors for lnx2awt and lnx2aΔ70, and whole cell lysates were analyzed by immuno blotting with anti-Lnx2a antibody. (B) Domain structure of Lnx2a and Lnx2b. (C) Expression patterns of the lnx gene family in the endoderm, using glucagon for comparison, at 48 hpf. lnx2b is expressed in the whole endoderm, whereas lnx1 and lnx3 are not expressed in the pancreas. (D) Schematic illustration of the lnx2b locus and lnx2b-MO targeting site, the splice donor site of exon 2. The protein coding and non-coding exons are indicated as solid and open boxes, and primers in exon 1 (F1), intron 2 (R2), and exon 10 (R1) are shown. (E) As seen by RT-PCR at 48 hpf, injection of lnx2b-MO reduces full length mRNA and generates intron 2 read-through mRNA. Note that the lnx2b-MO does not induce exon skipping, unlike the lnx2a-MO. lnx2a expression levels were not changed in lnx2b-MO injected embryos in the WT or the lnx2aΔ70 mutant. DP, Dorsal pancreas; VP, Ventral pancreas; In, Intestine; *, Non-specific bands; Scale bar, 50 µm.
Image
Figure Caption
Figure Data
Acknowledgments
This image is the copyrighted work of the attributed author or publisher, and
ZFIN has permission only to display this image to its users.
Additional permissions should be obtained from the applicable author or publisher of the image.
Full text @ Proc. Natl. Acad. Sci. USA

