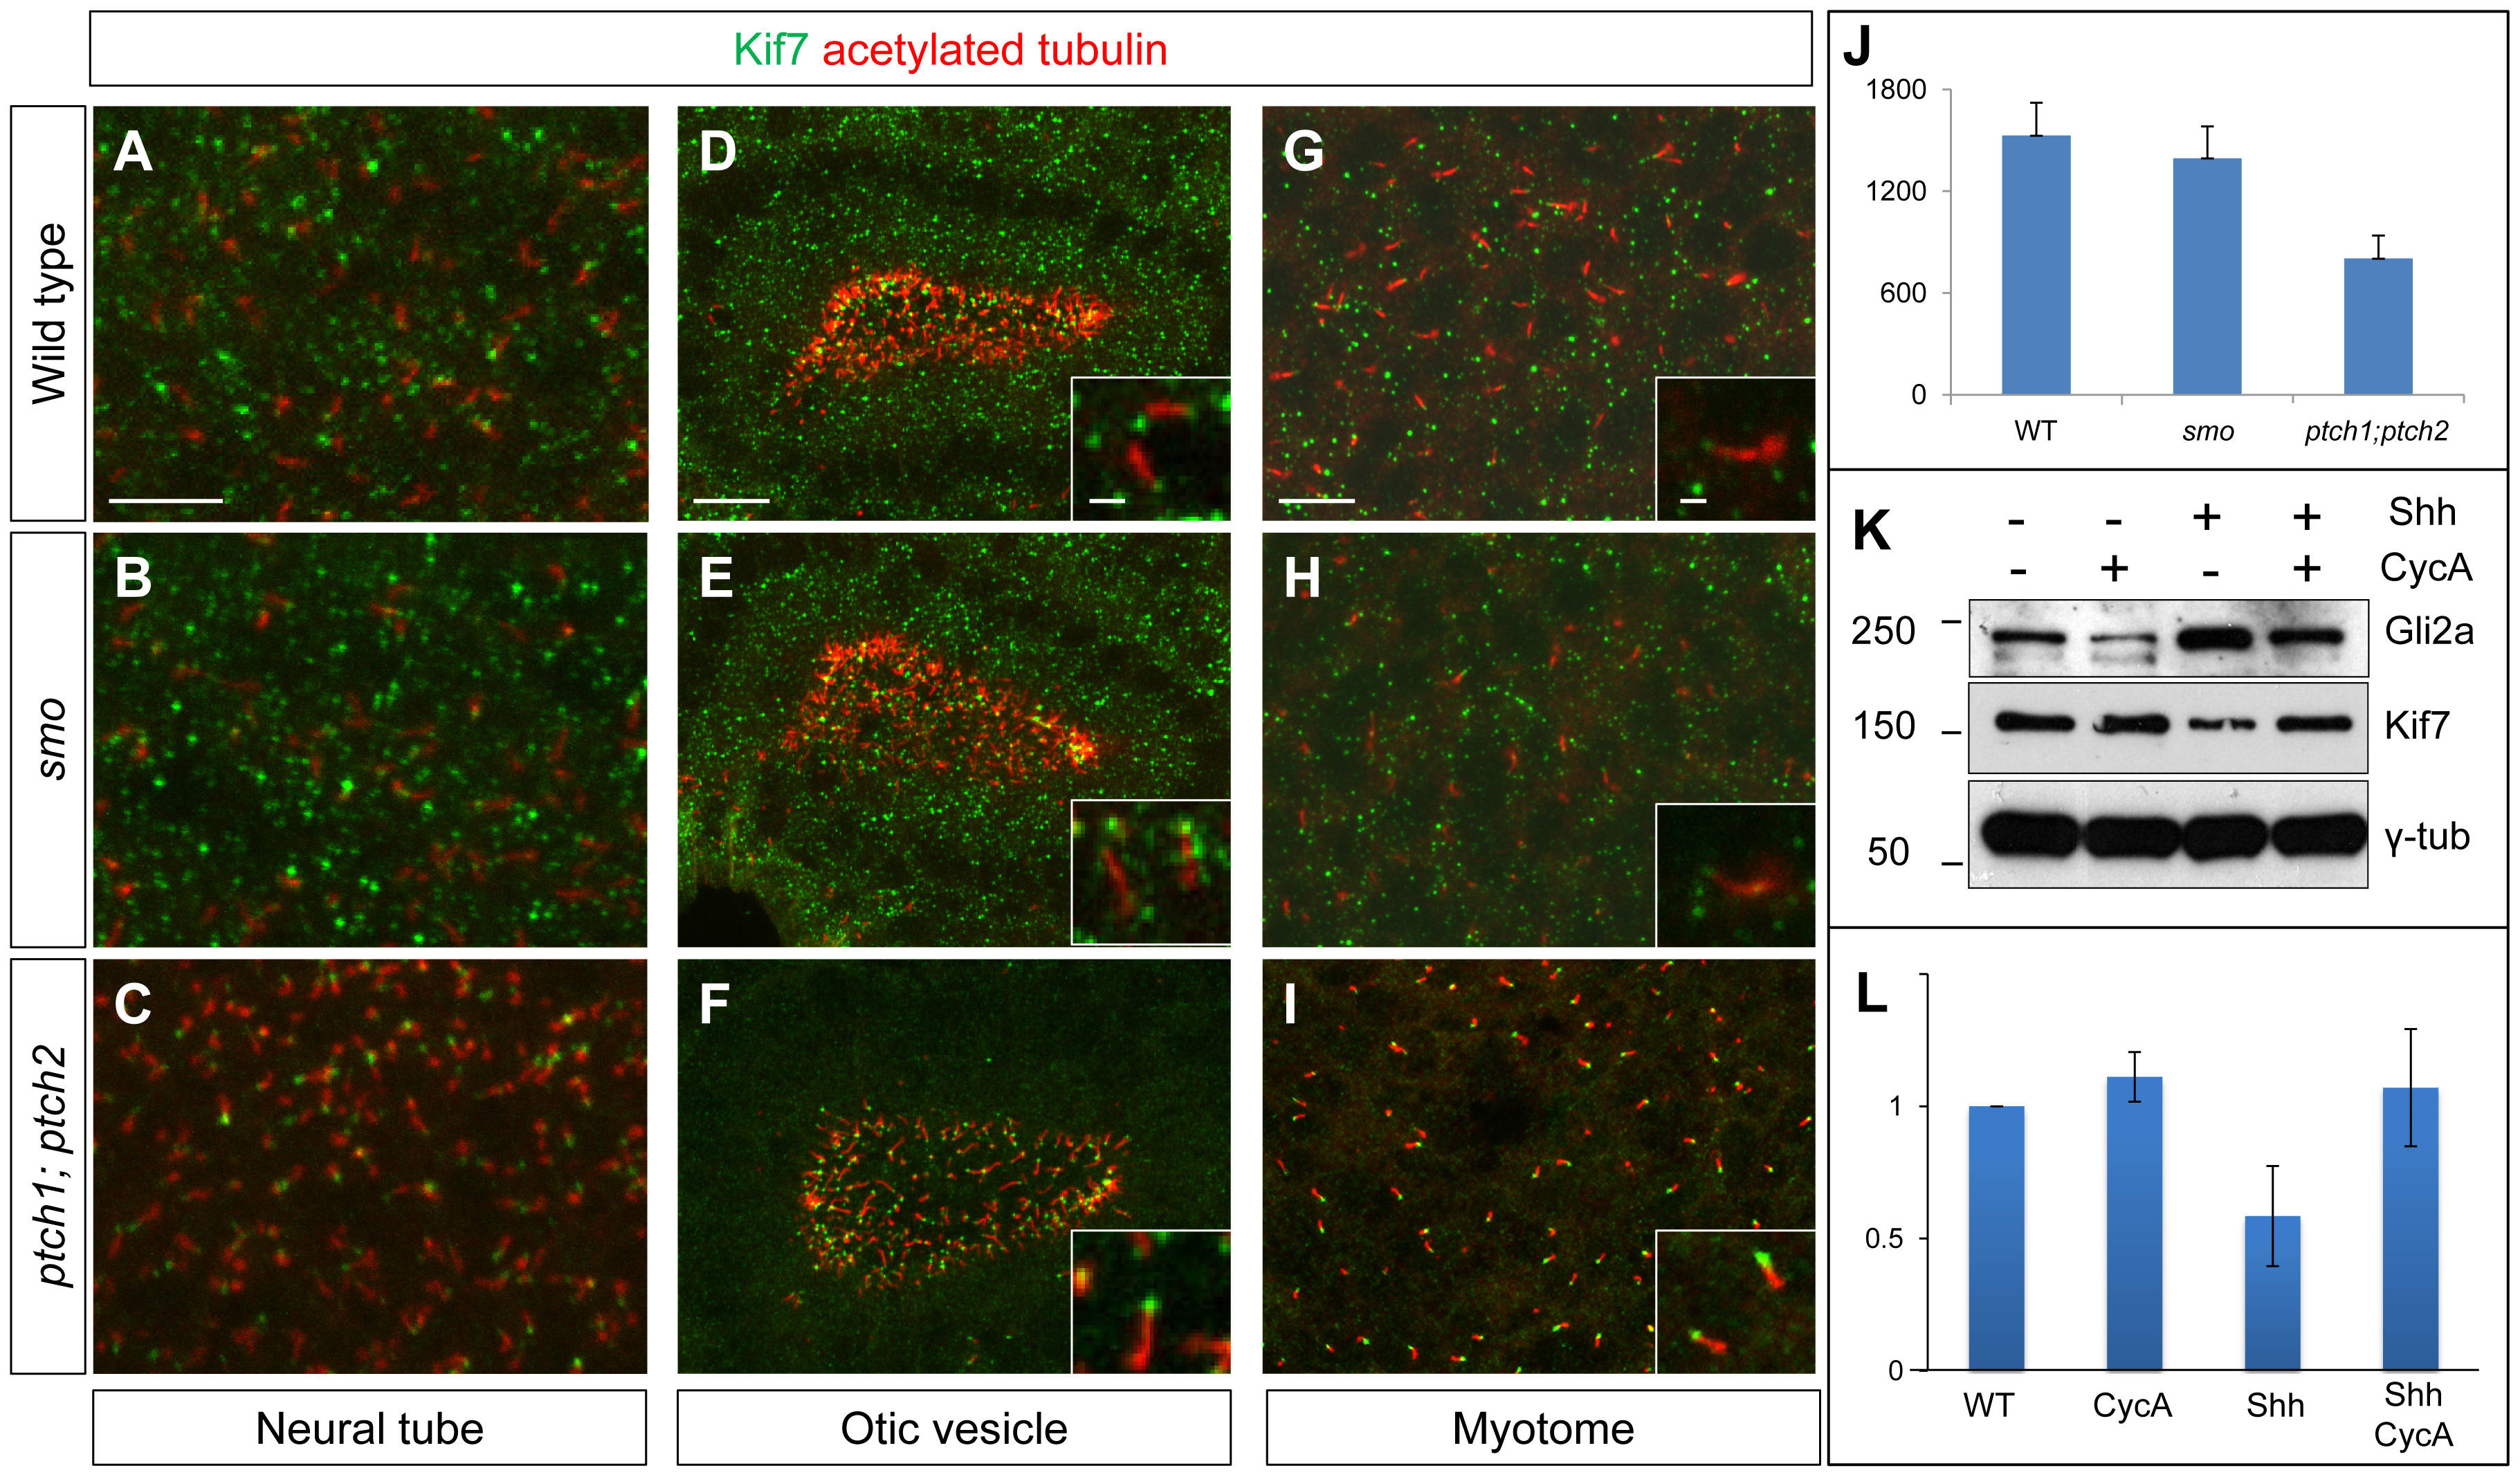
Fig. 10
Kif7 protein localization is modulated by Hh pathway activity.
(A–C) Parasagittal optical sections of the neural tube in 20ss embryos, showing the distribution of the endogenous Kif7 protein. In wild-type (A) and smo (B) embryos, Kif7 accumulates in puncta throughout the cytoplasm as well as in the primary cilium. In ptch1; ptch2 double mutant embryos (C) by contrast, the cytoplasmic puncta are completely absent with Kif7 remaining only at the tips of the cilia. Scale bar: 10 μm. (D–I) similar distributions of Kif7 are seen in the otic vesicle (D–F) and the myotome (G–I) of wild-type and mutant embryos. Insets show a magnified view of a part of each image; note that Kif7 accumulates at the tips of some primary cilia in wild-type (D,G), smo mutant (E,H) but at elevated levels in all cilia in ptch1;ptch2 double mutant (F,I) embryos. Scale bars: 10 μm; Inset scale bar: 1 μm. (J) Quantification of fluorescence intensity of Kif7 from the otic vesicle at 20ss from wild-type (WT), smo mutants and ptch1;2 double mutants, revealing a decrease in Kif7 levels detected by immunofluorescence. Error bars represent standard deviation in spot intensity in pre-processed confocal stacks. (K) Western blot analysis of endogenous Gli2a and Kif7 protein from wild-type (WT), cyclopamine exposed wild-type (WT), Shh RNA injected (Shh) and cyclopamine treated Shh RNA injected (Shh CycA) wild-type embryos exposed to cyclopamine. Note the increase in full-length Gli2a levels following Shh overexpression. Relative levels of Kif7 protein normalized to wild-type are indicated in (L).

