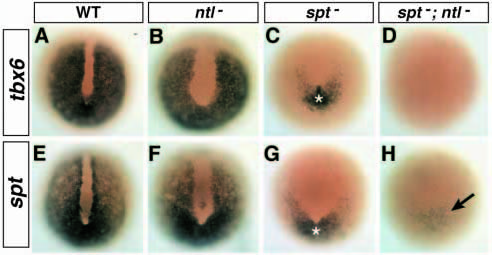
Fig. 7 Synergistic regulation of spt and tbx6 by spt and ntl. Expression of tbx6 (A-D; bud, 10 h.p.f.) and spt (E-H; 95% epiboly, 9.5 h.p.f.). In ntl- embryos expression of tbx6 (B) and spt (F) are similar to WT (A,E) except for broadening of the non-expressing notochord domain (Melby et al., 1997). In addition, spt is no longer prominently expressed by adaxial cells. In spt- embryos, expression of both tbx6 (C) and spt (G) are very weak or absent from hypoblast cells but remain detectable in the tail bud epiblast (*). In spt-;ntl- embryos, expression of tbx6 (D) is entirely undetectable, and spt (H) is only barely detected (arrow).
Image
Figure Caption
Figure Data
Acknowledgments
This image is the copyrighted work of the attributed author or publisher, and
ZFIN has permission only to display this image to its users.
Additional permissions should be obtained from the applicable author or publisher of the image.
Full text @ Development

