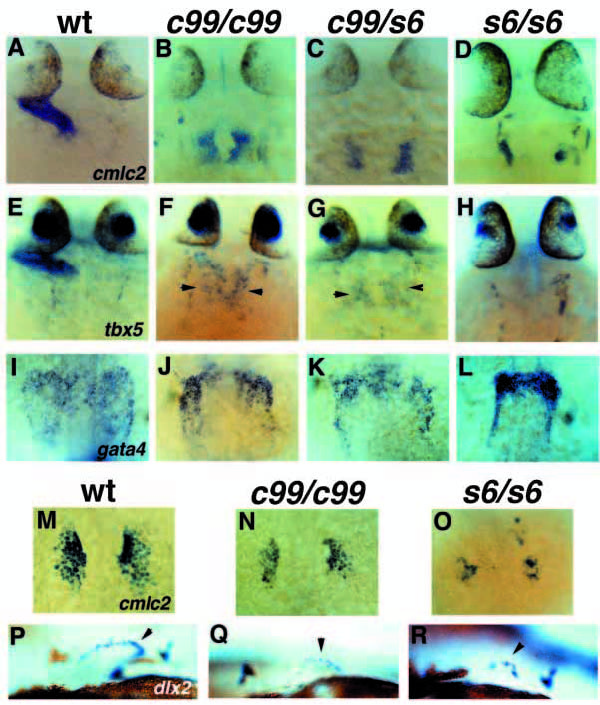
Fig. 4 Comparison of wild-type, hans6, hanc99 and transheterozygote phenotypes. (A-O) Dorsal views, anterior to the top. (A,E,I,M,P) Wild-type embryos; (B,F,J,N,Q) hanc99 mutants; (C,G,K) transheterozygous mutants; (D,H,L,O,R) hans6 mutants. In all cases, the hans6 phenotype is most severe, the hanc99 phenotype is most mild and the transheterozygote phenotype is intermediate. (A-D) cmlc2 expression at 24 hpf; (E-H) tbx5 expression at 24 hpf. Arrowheads (F,G) indicate myocardial tissue. (I-L) gata4 expression at the 16-somite stage. (M-O) cmlc2 expression at the 16-somite stage. (P-R) Lateral views of pectoral fin buds, anterior to the left, demonstrating expression of dlx2 in the apical epidermal fold (arrowheads) at 48 hpf. Continuous and strong dlx2 expression is observed in the apical fold of wild-type pectoral fins (P) (Akimenko et al., 1994), but dlx2 maintenance is defective in hanc99 (Q) and hans6 (R) mutants.
Image
Figure Caption
Figure Data
Acknowledgments
This image is the copyrighted work of the attributed author or publisher, and
ZFIN has permission only to display this image to its users.
Additional permissions should be obtained from the applicable author or publisher of the image.
Full text @ Development

