
Fig. 5
- ID
- ZDB-FIG-240708-5
- Publication
- Xia et al., 2021 - Developmental neurotoxicity of antimony (Sb) in the early life stages of zebrafish
- Other Figures
- All Figure Page
- Back to All Figure Page
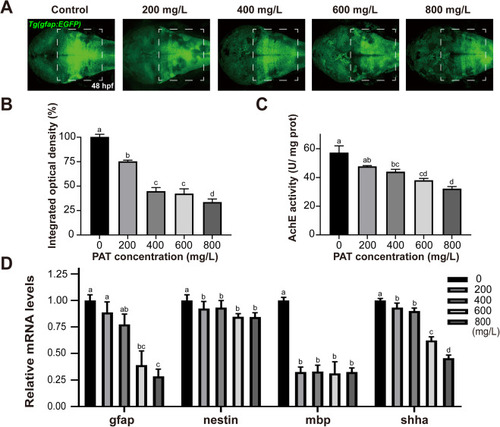
PAT impairs the development and function of the nervous system. (A) Representative confocal images showing the glial cells of the zebrafish brain in the background Tg(gfap:GFP) line of each group at 48 hpf. White box areas indicate the region of the midbrain and hindbrain. (B) The integrated optical density of the GFP. (C) AChE activity. (D) The relative mRNA levels of neurofunctional genes. Error bars indicate the mean ± SEM of three replicates. ANOVA with Tukey's post hoc test. Different letters indicate significant differences between treatments (p < 0.05). There was no significant difference if the same letter was used. |