
- Title
-
Developmental neurotoxicity of antimony (Sb) in the early life stages of zebrafish
- Authors
- Xia, S., Zhu, X., Yan, Y., Zhang, T., Chen, G., Lei, D., Wang, G.
- Source
- Full text @ Ecotoxicol. Environ. Saf.
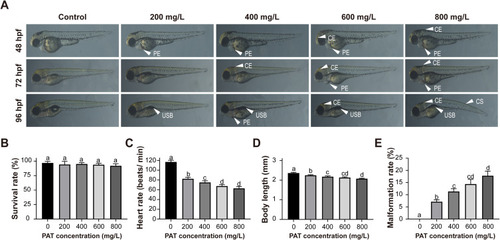
Morphological abnormalities and developmental toxicity induced by PAT. (A) Normal and representative morphologically abnormal zebrafish embryos. White arrowheads indicate the abnormalities. PE: pericardial edema, CE: cerebral hemorrhage, USB: uninflated swim bladder, CS: curved spine. (B-E) The statistics on the survival rate, heart rate, body length, and malformation rate. Error bars indicate the mean ± SEM of three replicates. ANOVA with Tukey's post hoc test. Different letters indicate significant differences between treatments (p < 0.05). There was no significant difference if the same letter was used. |

Spontaneous movement. (A) Schematic representation of embryonic spontaneous movement. (B) Tail flexion was recorded for 1 min at 19–27 hpf. Error bars indicate mean ± SEM of three replicates. ANOVA with Tukey's post hoc test. Different letters indicate significant differences between treatments (p < 0.05). There was no significant difference if the same letter was used. |
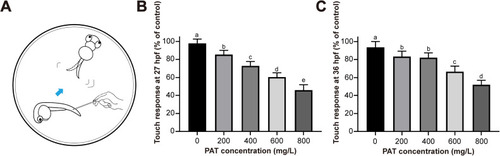
Touch response test. (A) Schematic representation of the touch response test. (B–C) The statistics of the tail response to contact at 27 and 36 hpf. Error bars indicate the mean ± SEM of three replicates. ANOVA with Tukey's post hoc test. Different letters indicate significant differences between treatments (p < 0.05). There was no significant difference if the same letter was used. |

Voluntary movement test. (A) The representative locomotion traces of zebrafish larvae exposed to PAT. (B) Free-swimming distances during 20 min of exposure to visible light. Error bars indicate the mean ± SEM of three replicates. ANOVA with Tukey's post hoc test. Different letters indicate significant differences between treatments (p < 0.05). There was no significant difference if the same letter was used. |
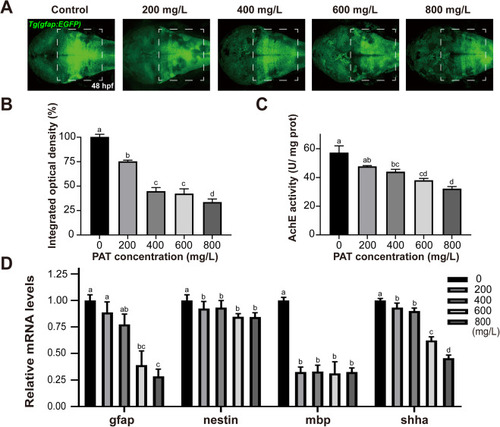
PAT impairs the development and function of the nervous system. (A) Representative confocal images showing the glial cells of the zebrafish brain in the background Tg(gfap:GFP) line of each group at 48 hpf. White box areas indicate the region of the midbrain and hindbrain. (B) The integrated optical density of the GFP. (C) AChE activity. (D) The relative mRNA levels of neurofunctional genes. Error bars indicate the mean ± SEM of three replicates. ANOVA with Tukey's post hoc test. Different letters indicate significant differences between treatments (p < 0.05). There was no significant difference if the same letter was used. |

Detection of oxidative stress in the embryo after PAT treatment. (A) Fluorescence images of ROS production in the brain and spinal cord regions at 72 hpf. (B) The integrated optical density of ROS. (C–E) MDA content, SOD activity, and GSH content in 24 hpf embryos. The error bars indicate the mean ± SEM of three replicates. ANOVA with Tukey's post hoc test. Different letters indicate significant differences between treatments (p < 0.05). The same letter indicates no significant difference. |