
Figure 1
- ID
- ZDB-FIG-240610-19
- Publication
- Zhang et al., 2024 - Enhancing CRISPR prime editing by reducing misfolded pegRNA interactions
- Other Figures
- All Figure Page
- Back to All Figure Page
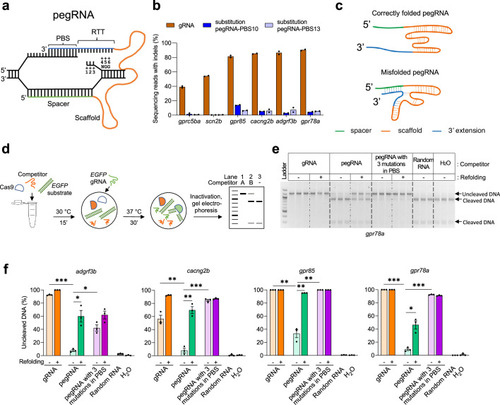
Improving in vitro SpCas9 binding efficiencies of pegRNA by refolding. (a) Schematic illustrating the hybridization of a pegRNA and its target DNA. Four segments of a pegRNA are shown. PBS, Primer Binding Site; RTT, Reverse Transcriptase Template. Target DNA positions (as well as the corresponding sequences in the RTT) are numbered counting from the SpCas9-induced nick towards ‘NGG’, the protospacer adjacent motif (PAM). (b) Mutation frequencies induced by SpCas9 with gRNAs and pegRNAs in zebrafish. All pegRNAs carried a single nucleotide substitution at position +5 or+6, with RTT lengths of 14- or 15-nucleotide (nt), and PBS lengths of 10-nt (pegRNA-PBS10) or 13-nt (pegRNA-PBS13). Target loci are indicated at the bottom. SpCas9 protein was complexed with gRNA or pegRNA at a molar ratio of 1:2 (0.6 µM of gRNA or pegRNA). (c) Schematic illustrating hypothetical conformations of correctly folded and misfolded pegRNAs. The spacer is shown in green, Cas9-binding scaffold in orange and 3’ extension including PBS and RTT in blue. Dotted lines indicate potential base pairings. (d) Schematic illustrating the in vitro competition assay for Cas9 binding and substrate cleavage. Possible outcomes of the assay are shown in a representative gel. Lane 1 shows the addition of Competitor A with a high SpCas9-binding affinity resulting in 100% inhibition of cleavage of DNA substrates (1.2 kilobase pairs). Lane 2 shows the addition of Competitor B with a low SpCas9-binding affinity yielding a mix of uncleaved and cleaved (900 and 300 base pairs) DNA substrate. Lane 3 shows the reaction without any competitor resulting in 100% cleaved DNA products. (e) Agarose gel image showing the results of in vitro SpCas9 cleavage of DNA substrate in the presence of gRNA or pegRNAs targeting gpr78a as competitors, with or without refolding (indicated on top of the gel). Random RNA isolated from tolura yeast was used as a negative control. Assays were performed in triplicate. (f) Percentage of uncleaved DNA substrate in the presence or absence of competitor gRNA or pegRNA calculated using data from Figure 1—source data 1 and Figure 1—source data 2. Competitor gRNA and pegRNA target loci are indicated at the top. Competitor types are shown at the bottom. Dots represent individual data points, bars the mean and error bars ± s.e.m. Unpaired two-tailed t-test with equal variance was used to compare non-refolded gRNA vs non-refolded pegRNA, non-refolded pegRNA vs non-refolded pegRNA with three mutations in PBS, and non-refolded vs refolded pegRNAs. *p<0.05, **p<0.01, ***p<0.001. |