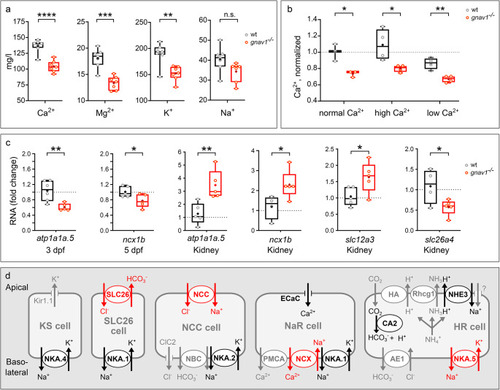
Decreased cation levels and altered ion transporter gene expression in Gv mutant zebrafish. Data for panels a) to c) are shown as whisker plots with quartile segments, mean values are indicated by crosses, individual measurements are shown as circles. (a) Cation levels were analysed by atomic absorption spectroscopy in pools of 25 larvae from sibling parents (5 dpf), n = 7 biological replicates. Note that all levels decrease in the mutant compared to wildtype (wt), three of them significantly. (b) A decrease in calcium levels in the mutant persists both in high and in low calcium rearing. Calcium levels are normalized to wildtype in normal calcium, n = 3–4 biological replicates. (c) qPCR of 3 dpf and 5 dpf larval pools (20 larvae, Gv mutant and wildtype from sibling parents) and adult kidneys of Gv mutants and their wildtype siblings showed altered gene expression as indicated, 4–5 biological replicates. Note that mutant adult kidney appeared phenotypically normal and showed no signs of edema. a, b, c) Significance was estimated by two tailed unpaired t-test: *, p < 0.05, **, p < 0.01, ***, p < 0.001; ****, p < 0.0001. (d) Current understanding of ion transporters, channels and exchangers in zebrafish ionocytes is depicted schematically (scheme modified from [27]. A largely overlapping set of genes is present in kidney [28]. Red ovals and arrows, significant alteration of expression was seen in the Gv mutant. Black ovals and arrows, no significant changes; gray ovals and arrows, not tested. Protein names are given, NKA.5 refers to gene atp1a1a.5; SLC26 refers to gene slc26a4; NCC refers to gene slc12a3, NCX refers to gene ncx1b
|
