|
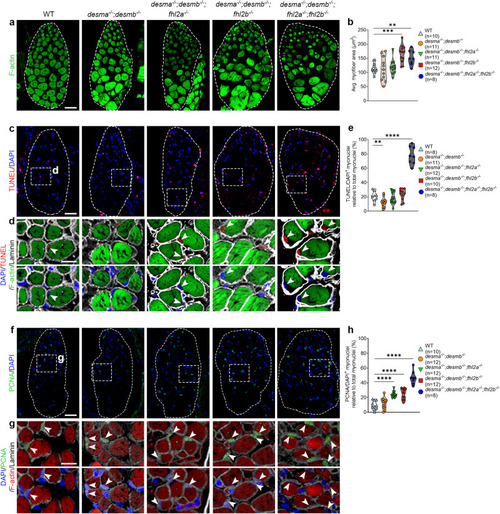
Lack of Fhl2 causes EOM myofiber hypertrophy. Cross-sections of 12 months old WT, desma−/−;desmb−/−, desma−/−;desmb−/−;fhl2a−/−, desma−/−;desmb−/−;fhl2b−/− and desma−/−;desmb−/−;fhl2a−/−; fhl2b−/− zebrafish EOMs. a F-actin labeling (phalloidin) and b average F-actin positive myofiber area quantification in WT, desma−/−;desmb−/−, desma−/−;desmb−/−;fhl2a−/−, desma−/−;desmb−/−;fhl2b−/− (p = 0.0002) and desma−/−;desmb−/−;fhl2a−/−;fhl2b−/− (p = 0.007) mutant zebrafish. c DAPI and TUNEL labeling of myonuclei. Dashed boxes indicate magnified areas in d). d TUNEL (top) and DAPI (bottom) labeling of myonuclei inside the myofiber laminin sheet. Phalloidin labels F-actin in the myofibers. White arrowheads indicate TUNEL positive myonuclei. e Quantification of DAPI+/TUNEL+ myonuclei in WT, desma−/−;desmb−/− (p = 0.021), desma−/−;desmb−/−;fhl2a−/−, desma−/−;desmb−/−;fhl2b−/− and desma−/−;desmb−/−;fhl2a−/−;fhl2b−/− (p = 2.2e−7) mutant zebrafish. f DAPI/PCNA labeling of myonuclei. Dashed boxes indicate magnified areas in g). g DAPI/PCNA labeling of myonuclei inside the myofiber laminin sheet. Phalloidin labels F-actin. White arrowheads indicate double positive myonuclei. h Quantification of PCNA+ myonuclei in WT, desma−/−;desmb−/−, desma−/−;desmb−/−;fhl2a−/− (p = 8.8e−5), desma−/−;desmb−/−;fhl2b−/− (p = 2.3e−5), and desma−/−;desmb−/−;fhl2a−/−;fhl2b−/− (p = 4.6e−7) mutant zebrafish. Dashed lines outline the entire cross-section of the EOMs. Statistical analysis: Two-sided t-tests with Welch correction. Data in all violin plots is presented as median (line) and quartiles (dashed line). Avg average. Scale bar in a, c, f: 25 µm, d, g: 10 µm.
|