|
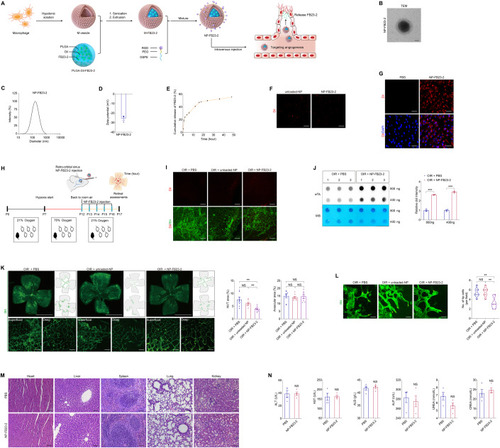
Characteristics of NP-FB23-2 and evaluation of its therapeutic efficacy on retinal neovascularization in mice. (A) Experimental scheme illustrating the synthetic procedures of NP-FB23-2. (B) TEM of Dil labeled NP-FB23-2. n = 3. Scale bar: 50 nm. (C) The size distribution profile of NP-FB23-2s. (D) The surface zeta potential of NP-FB23-2s. n = 3. (E) Release of FB23-2 from NP-FB23-2s in PBS at 37 °C over the course of 48 h. (F) Fluorescence demonstrated by Dil labeled unloaded-NP and NP-FB23-2s. Scale bar: 20 µm. (G) Fluorescent images of HUVECs treated with PBS or NP-FB23-2s. Cell nuclei are counterstained with DAPI. n = 3 per group. Scale bar: 65 µm. (H) Experimental scheme for (I–L). (I) Fluorescent images of neural retinas collected from OIR mice intravenously injected with PBS, unloaded-NP or NP-FB23-2s. Retinal vasculatures are stained with IB4. n = 3 per group. Scale bar: 50 µm. (J) m6A dot blot assay of global m6A abundance in retinas of OIR mice intravenously injected with PBS or NP-FB23-2s at P17 using 800 or 400 ng total RNAs. MB staining is applied as a loading control. n = 3 per group. (K) Fluorescence staining of IB4 in retinal flat mounts originated from OIR mice intravenously injected with PBS, unloaded-NP or NP-FB23-2s at P17. n = 8 per group. Superficial and deep vascular plexuses are shown by magnificent images. Gray dotted lines indicate the edge of the retina. Red lines suggest the avascular area. NVTs are represented by red dots. Representative images along with quantification results of NVT and avascular areas are shown. Scale bar: 2000 µm (up); 50 µm (below). (L) Fluorescence staining of IB4 in retinal flat mounts originated from OIR mice with indicated treatments at P17. n = 7 per group. Tip cells are represented by yellow asterisks. Scale bar: 30 µm. (M) Representative H&E staining images of major organs including the heart, liver, spleen, lung and kidney from mice intravenously injected with PBS or NP-FB23-2s. n = 3 per group. Scale bar: 75 µm. (N) Blood ALT, AST, CREA, UREA, ALB and ALP levels in mice intravenously injected with PBS or NP-FB23-2s. n = 4 per group. Data information: Data represent different numbers (n) of biological replicates. Data are shown as mean ± SEM. Two-tailed Student’s t test is used in (J, N). One-way ANOVA followed by Bonferroni’s test is used in (K, L). NS: not significant (p > 0.05); *p < 0.05; **p < 0.01; and ***p < 0.001. Source data are available online for this figure.
|