|
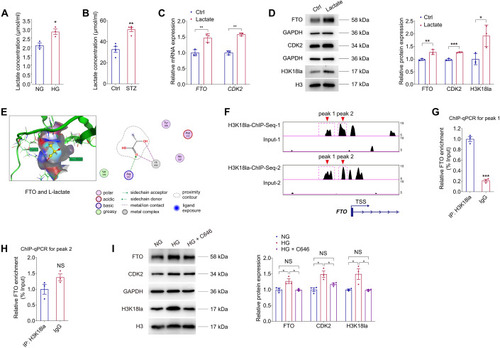
Lactic acid regulates FTO expression via histone lactylation. (A) Lactate concentration in HUVECs treated with NG or HG. n = 3 per group. (B) Lactate concentration in neural retinas originated from control and STZ mice. n = 4 per group. (C) qPCR presents mRNA levels of FTO and CDK2 in HUVECs treated with or without lactate (10 mM). n = 3 per group. (D) Immunoblotting of FTO, CDK2 and H3K18la in HUVECs treated with or without lactate. GAPDH and H3 are used as internal controls. n = 3 per group. (E) MOE is used to predict the binding affinity between the FTO protein and L-lactate. (F) Enrichment of the H3K18la signal (two peaks) in the promoter region of the FTO gene is demonstrated by ChIP-Seq using anti-H3K18la antibodies (GEO accession number: GSE156675). (G, H) ChIP-qPCR using anti-H3K18la antibodies validates H3K18la enrichment in peak 1 but not peak 2 within the promoter region of FTO in HUVECs. n = 3 per group. (I) Immunoblotting of FTO, CDK2 and H3k18la in HUVECs with different treatments. GAPDH and H3 are used as internal controls. n = 3 per group. Data information: Data represent different numbers (n) of biological replicates. Data are shown as mean ± SEM. Two-tailed Student’s t test is used in (A–D, G–H). One-way ANOVA followed by Bonferroni’s test is used in (I). NS: not significant (p > 0.05); *p < 0.05; **p < 0.01; and ***p < 0.001. Source data are available online for this figure.
|

