FIGURE

Figure 9

ID
ZDB-FIG-240226-172
Publication
Raman et al., 2024 - The Osteoblast Transcriptome in Developing Zebrafish Reveals Key Roles for Extracellular Matrix Proteins Col10a1a and Fbln1 in Skeletal Development and Homeostasis
Other Figures
All Figure Page
Back to All Figure Page
Figure 9

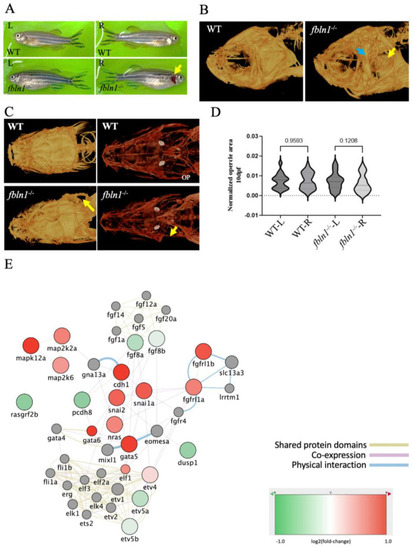
fbln1−/− mutant zebrafish show missing opercle on the right side. (A) Adult fbln1−/− fish bright field image showing the missing opercle (yellow arrow). (B) 3D Reconstructed images from µCT scans of adult WT control and fbln1−/− fish head (yellow arrow: missing opercle, blue arrow: thickened subopercular bone). (C) 10 dpf Alizarin red stained zebrafish in ventral view (yellow arrow: missing opercle). (D) Left (L) and Right (R) opercle area measured in ventral view on 10 dpf alizarin red stained WT control and fbln1−/− zebrafish larvae show the trend of asymmetry between the L and R opercles in fbln1−/− mutant zebrafish (n = 34 WT, n = 37 fbln1−/− mutants). (E) Differentially expressed genes in fbln1−/− mutants that are involved in Fgf and Mapk signaling.

Expression Data

Expression Detail
Antibody Labeling
Phenotype Data

Phenotype Detail
Acknowledgments
This image is the copyrighted work of the attributed author or publisher, and ZFIN has permission only to display this image to its users. Additional permissions should be obtained from the applicable author or publisher of the image. Full text @ Biomolecules