FIGURE SUMMARY
Title

The Osteoblast Transcriptome in Developing Zebrafish Reveals Key Roles for Extracellular Matrix Proteins Col10a1a and Fbln1 in Skeletal Development and Homeostasis

Authors
Raman, R., Antony, M., Nivelle, R., Lavergne, A., Zappia, J., Guerrero-Limón, G., Caetano da Silva, C., Kumari, P., Sojan, J.M., Degueldre, C., Bahri, M.A., Ostertag, A., Collet, C., Cohen-Solal, M., Plenevaux, A., Henrotin, Y., Renn, J., Muller, M.
Source
Full text @ Biomolecules

The osteoblasts at 4 dpf reveal two distinct populations based on the GFP fluorescence intensity and differential gene expression. (A) FACS plot showing forward scattering (FSC-A) and GFP fluorescence in singlet, living cells in gates P1 and P2. Cell distribution according to their GFP fluorescence is also shown to illustrate the two subpopulations P1 and P2. Gates were set to exclude the 100-fold larger population of non-fluorescent cells for illustration. (B) Number of DEGs that are up- or down-regulated in the different comparisons. (C) Venn diagram comparing the DEGs in “AllvsP1”, “AllvsP2”, and “P1vsP2”. (D) PCA plot, based on the 500 most variable genes in terms of normalized read counts in all individual samples, showing that the two cell subpopulations P1 and P2 are clearly different from each other, but very different from the whole larvae “All” population at 4 dpf. (E) Selected terms enriched in the DEG lists “AllvsP1”, “AllvsP2”, and “P1vsP2” as determined by GSEA analysis; columns represent the list concerned, the database used, the dataset concerned, its name, the normalized enrichment score, and the false discovery rate value (FDR). Positive enrichment scores indicate up-regulated terms (highlighted in red), negative ones refer to down-regulated terms (highlighted in green).

Specific genes present variable expression patterns when comparing the different cell populations. (A) change in the number of reads relative to the “All” population of selected genes; For each gene, the color code indicates the number of reads relative to the total number of reads for this gene in all the samples. (B) relative gene expression in the different cell populations. All samples are represented here: 10 for the “All” population, 5 for the P1, and 3 for the P2 subpopulations.

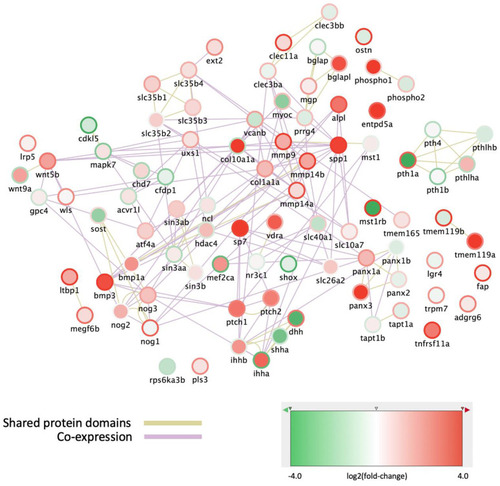
Expression changes in osteoblast subpopulations of genes involved in bone mineralization and ossification. The nodes represent genes, outer ring color represents the log(fold-change) between “All” to the P1 subpopulation, while the fill color represents the log(fold-change) between P1 and P2 subpopulations. The network was generated in Cytoscape, using the GeneMANIA databases for zebrafish Shared protein domains and Co-expression.

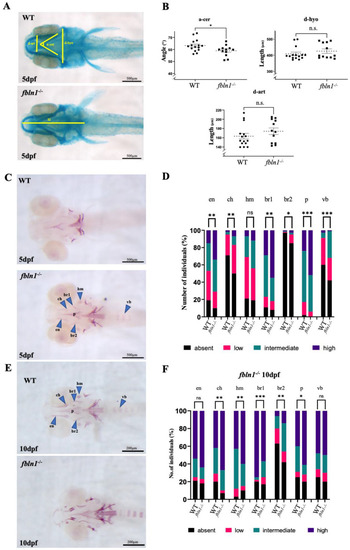
col10a1a−/− mutants display a small chondrocranium at 5 dpf and decreased mineralization at 10 dpf compared to wt controls. (A) Ventral view of alcian blue stained WT and col10a1a−/− larvae at 5 dpf. The distances measured are indicated as described in Mat. and Meth. (B) col10a1a−/− reveal reduced head size at 5 dpf compared to WT (p < 0.01; WT n = 12, col10a1a−/− n = 15). Measures are distances from anterior to the posterior end of the ethmoid plate (head length-hl), between the two hyosymplectics (d-hyo), between the articulations joining the Meckel’s cartilage to the palatoquadrate (d-art), and the angle formed by the two ceratohyals (a-cer). (C) Ventral view of alizarin red stained WT and col10a1a−/− larvae at 10 dpf. The blue arrowheads point to the skeletal elements: maxillary (m), dentary (d), parasphenoid (p), entopterygoid (en), branchiostegal rays 1 and 2 (br1/br2). Inserts show the maxillary and dentary. (D) Fraction (%) of individuals presenting a high (green), reduced (red), or absent (black) level of bone mineralization in the different bone elements in WT and col10a1a−/− fish at 10 dpf. (WT n = 20, col10a1a−/− n = 17). (n.s. = non significant) significance: ** p < 0.01, *** p < 0.001, and **** p < 0.0001.

Adult col10a1a−/− zebrafish have decreased vertebral TMD and altered bone properties. (A) Representative µCT scans (MIPi = Maximum Intensity Projected image) of a year-old adult WT (top) and col10a1a−/− (bottom) reveal a decreased mineralization and fusion of the caudal fin vertebrae in the mutant. (B) Lateral view of pre-caudal vertebrae 6–8 (L to R) for WT and col10a1a−/− fish. (C) Representative µCT scan of a vertebra in 3 planar views, showing the two morphometric measurements: vertebral thickness (µm) and vertebral length (µm). (D) Comparison of morphometric measures on precaudal vertebrae 6–8 (n = 4 fish/group) in WT and col10a1a−/− fish. (E) Line plots generated using the FishCut software version 1.2 revealing significantly decreased TMDs in vertebra (Vert.TMD) and centra (Cent.TMD), as well as neural and centra surface areas (Neur.SA, Cent.SA) in col10a1a−/− relative to WT, while centra and neural arch volumes (Cent.Vol, Neur.Vol) were not significantly affected (* p < 0.05), (n = 6 fish/group). (F) col10a1a−/− mutants display fusion of the tail fin vertebra. (n.s. = non significant) significance: *** p < 0.001, and **** p < 0.0001.

fbln1−/− mutants present increased mineralization at 5 dpf compared to WT. (A) Ventral view of alcian blue stained WT and fbln1−/− larvae at 5 dpf. The distances measured are indicated. (B) fbln1−/− reveal reduced angle between ceratohyals (a-cer) at 5 dpf compared to WT (WT n = 15, fbln1−/− n = 12). (C) Ventral view of alizarin red stained WT and fbln1−/− larvae at 5 dpf. The blue arrowheads point to the skeletal elements: ceratohyal (ch), parasphenoid (p), entopterygoid (en), branchiostegal rays 1 and 2 (br1/br2), hyomandibular (hm), and vertebral body (vb). (D) Fraction (%) of individuals presenting a high (dark blue), intermediate (green), low (red), or absent (black) level of bone mineralization in the different bone elements in WT and fbln1−/− fish at 5 dpf. (WT n = 52, fbln1−/− n = 68). (E) Ventral view of alizarin red stained WT and fbln1−/− larvae at 10 dpf. (F) Fraction (%) of individuals presenting a high (dark blue), intermediate (green), low (red), or absent (black) level of bone mineralization in the different bone elements in WT and fbln1−/− fish at 10 dpf. (WT n = 35, fbln1−/− n = 40). (n.s. = non significant), significance: * p < 0.05, ** p < 0.01, and *** p < 0.001.

fbln1−/− adult zebrafish exhibit increased vertebral TMD and vertebral thickness. (A) µCT scans (MIPi = Maximum Intensity Projected image) of 1 year old adult WT and mutants. fbln1−/− larvae show an increased mineralization. (B) Lateral view of Vertebrae 6–8 (L to R) for WT and fbln1−/−, respectively. (C) Representative µCT scan of a vertebra in 3 planar views, showing two morphometric measurements: vertebral thickness (µm) and vertebral length (µm). (D) Morphometric analysis of individual precaudal vertebral body numbers 6–8 (n = 4 fish/group) revealed a significantly increased thickness and length of the vertebral body in fbln1−/− compared to WT controls. (E) Line plots generated using FishCuT software version 1.2 show significantly increased centra volume (Cent.Vol) and surface area (Cent.SA) in fbln1−/− compared to WT controls (n = 7 fish/group). Similarly, both vertebral (Vert.TMD) and centra TMD (Cent.TMD) are significantly increased in fbln1−/−. Significance: * p < 0.05, ** p < 0.01, and *** p < 0.001, n.s. = non-significant.

Changes of transcriptome in fbln1−/− mutants relative to WT at 10 dpf. (A) Log(fold-change) and p-values for some genes selected for their known role in osteogenesis. (B) Selected functional annotations of the list of DEGs in fbln1−/− mutants. (C) Network of DEGs centered around the genes involved in collagen biosynthesis. Red color refers to functions or genes that are upregulated, Green indicates genes or functions that are down-regulated in the mutants. In (C), the edges are color-coded according to the nature of interaction between nodes (genes) as indicated.

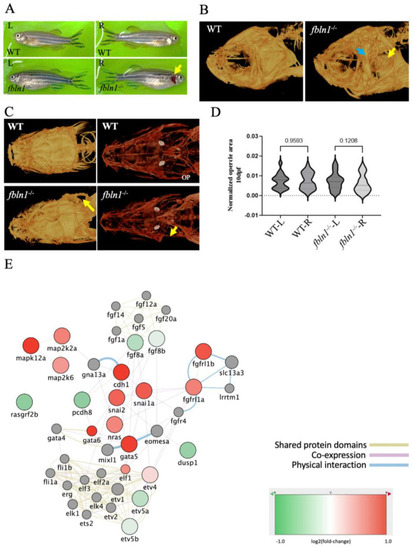
fbln1−/− mutant zebrafish show missing opercle on the right side. (A) Adult fbln1−/− fish bright field image showing the missing opercle (yellow arrow). (B) 3D Reconstructed images from µCT scans of adult WT control and fbln1−/− fish head (yellow arrow: missing opercle, blue arrow: thickened subopercular bone). (C) 10 dpf Alizarin red stained zebrafish in ventral view (yellow arrow: missing opercle). (D) Left (L) and Right (R) opercle area measured in ventral view on 10 dpf alizarin red stained WT control and fbln1−/− zebrafish larvae show the trend of asymmetry between the L and R opercles in fbln1−/− mutant zebrafish (n = 34 WT, n = 37 fbln1−/− mutants). (E) Differentially expressed genes in fbln1−/− mutants that are involved in Fgf and Mapk signaling.

Acknowledgments
This image is the copyrighted work of the attributed author or publisher, and ZFIN has permission only to display this image to its users. Additional permissions should be obtained from the applicable author or publisher of the image. Full text @ Biomolecules