|
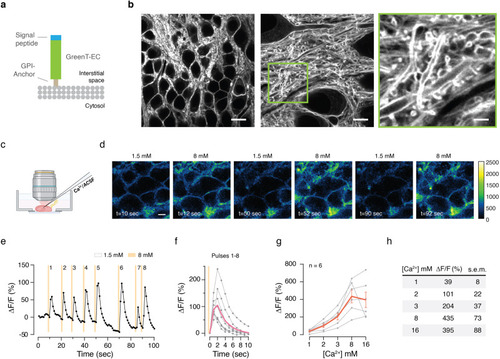
Validation of GreenT-EC in rodent hippocampus.a Scheme of surface targeted GreenT-EC (green) by means of an N-terminal signal peptide (blue) and a C-terminal GPI anchor (brown). b STED images of AAV-GreenT-EC infected neurons in hippocampal area CA1 of organotypic slice cultures (7 days postinfection). Scale bars: 10 μm, 5 μm, 2 μm, for left, middle and right panel, respectively. c Application of calcium solution to brain slices via micropipettes. d Time series representative images showing fluorescence changes in transfected hippocampal organotypic slices when exposed to 1.5 mM and 8 mM extracellular calcium. Scale bar 10 μm. e Dynamic GreenT-EC fluorescence changes upon repetitive brief (500 ms each) high-calcium (8 mM) solution puffs from baseline levels of 1.5 mM. Orange lines indicate the timing of the puffs. f Averaged response curves to the calcium injections from experiment e. g Calibration of GreenT-EC signals in hippocampal slices. The response was calculated using 0.5 mM Ca2+ as the basal fluorescence value. Each gray line corresponds to a different slice (n = 6 biological replicates). The orange line represents the mean value at each calcium concentration (the error bar corresponds to the s.e.m.). h Summary table of mean responses and s.e.m. obtained in the calibration experiment presented in g. Source data are provided in the Source Data file.
|