FIGURE

Fig. 3

ID
ZDB-FIG-231009-13
Publication
Valiente-Gabioud et al., 2023 - Fluorescent sensors for imaging of interstitial calcium
Other Figures
All Figure Page
Back to All Figure Page
Fig. 3

Flow cytometry analysis of GreenT-EC cell surface exposure.

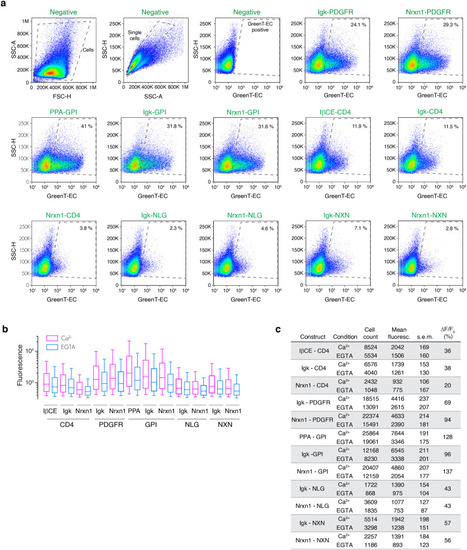
Twelve combinations of export signal peptides and transmembrane/anchoring domains were used to target GreenT-EC to the surface of the cell. HeLa cells were transiently transfected with each construct and analyzed using flow cytometry. a Density plots of the negative control (non-transfected) indicating the gating strategy for selecting GreenT-EC positive single cells (indicated in slashed lines). Both the negative and the rest of the constructs displayed were resuspended in a MOPS buffer containing 3 mM CaCl2. b The fluorescence of GreenT-EC positive gated cells was further analyzed before and after the addition of EGTA (final concentration of 7.5 mM). Box-plots 90-10% are presented (whiskers are 90 and 10 percentiles, boxes are 75 and 25 percentiles and the center line correspond to the median). c Summary table compiling the main parameters of the experiment: Number of cells gated as GreenT-EC positive in each condition (n=cell count), mean fluorescence of GreenT-EC (mean fluoresce.), standard error of the mean (s.e.m) and the response calculated between the mean GreenT-EC fluorescence values before and after the addition of EGTA (ΔF/F0). Source data are provided in the Source Data file.

Expression Data

Expression Detail
Antibody Labeling
Phenotype Data

Phenotype Detail
Acknowledgments
This image is the copyrighted work of the attributed author or publisher, and ZFIN has permission only to display this image to its users. Additional permissions should be obtained from the applicable author or publisher of the image. Full text @ Nat. Commun.