
Figure 1
- ID
- ZDB-FIG-230707-62
- Publication
- Chen et al., 2023 - Defining function of wild-type and three patient specific TP53 mutations in a zebrafish model of embryonal rhabdomyosarcoma
- Other Figures
-
- Figure 1
- Figure 1— supplement 1.
- Figure 1— supplement 2.
- Figure 2.
- Figure 3
- Figure 3—figure supplement 1.
- Figure 3—figure supplement 2.
- Figure 3—figure supplement 3.
- Figure 3—figure supplement 4.
- Figure 4
- Figure 4—figure supplement 1.
- Figure 4—figure supplement 2.
- Figure 4—figure supplement 3.
- Figure 5
- Figure 5—figure supplement 1.
- Figure 5—figure supplement 2.
- Figure 5—figure supplement 3.
- Figure 5—figure supplement 4.
- Figure 6
- Figure 6—figure supplement 1.
- Figure 6—figure supplement 2.
- Figure 6—figure supplement 3.
- Figure 6—figure supplement 4.
- Figure 7
- Figure 7—figure supplement 1.
- All Figure Page
- Back to All Figure Page
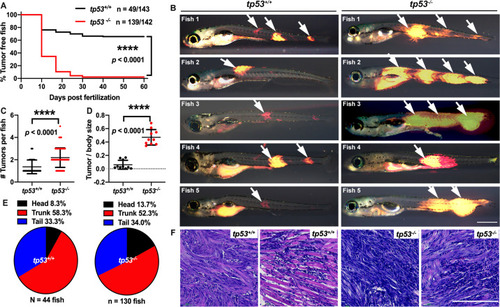
tp53 suppresses embryonal rhabdomyosarcoma (ERMS) tumor initiation. (A) Kaplan–Meier plot showing ERMS tumor initiation in tp53-/- and tp53+/+ fish. (B) Representative images of DsRed-positive zebrafish ERMS. Arrows show tumor location for each fish. All tumor-burdened zebrafish are 10 days old. Scale bar = 0.5 mm. (C) Tumor numbers per zebrafish in tp53-/- and tp53+/+ fish. n = 44 (tp53+/+), n=130 (tp53-/-). (D) Ratio of tumor area to total body area in in tp53-/- and tp53+/+ fish. n = 10. (E) Pie chart showing percentage of tumors found in varying regions of tp53-/- and tp53+/+ fish, showing no significant differences in tumor localization. Head – p=0.25848, trunk – p=0.39532, tail – p=0.92034 (two-tailed two proportions Z-test). (F) Representative H&E staining of zebrafish ERMS tumors. Scale bar = 100 µm. |