
FIGURE
Fig. 3.
- ID
- ZDB-FIG-230518-104
- Publication
- Keatinge et al., 2023 - Unexpected phenotypic and molecular changes of combined glucocerebrosidase and acid sphingomyelinase deficiency
- Other Figures
- All Figure Page
- Back to All Figure Page
Fig. 3.
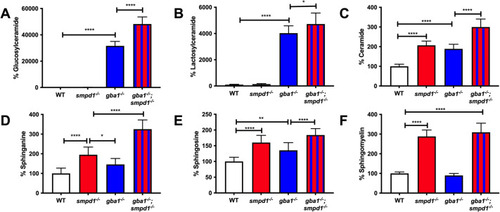
Accumulation of key glycolipids across gba1−/− and smpd1−/− single-mutant and gba1−/−;smpd1−/− double-mutant genotypes. Relative glucosylceramide (A), lactosylceramide (B), ceramide (C), sphinganine (D), sphingosine (E) and sphingomyelin (F) levels in WT, single-mutant gba1−/− and smpd1−/−, and double-mutant gba1−/−;smpd1−/− zebrafish. n=10 brains from 12-week-old zebrafish used per group. Data represented are the mean±s.d. *P<0.05; **P<0.01; ****P<0.0001 (two-way ANOVA with Tukey's multiple comparisons). |
Expression Data
Expression Detail
Antibody Labeling
Phenotype Data
| Fish: | |
|---|---|
| Observed In: | |
| Stage: | Adult |
Phenotype Detail
Acknowledgments
This image is the copyrighted work of the attributed author or publisher, and
ZFIN has permission only to display this image to its users.
Additional permissions should be obtained from the applicable author or publisher of the image.
Full text @ Dis. Model. Mech.