Figure 1
- ID
- ZDB-FIG-230428-3
- Publication
- Frantz et al., 2023 - Pigment cell progenitor heterogeneity and reiteration of developmental signaling underlie melanocyte regeneration in zebrafish
- Other Figures
- All Figure Page
- Back to All Figure Page
|
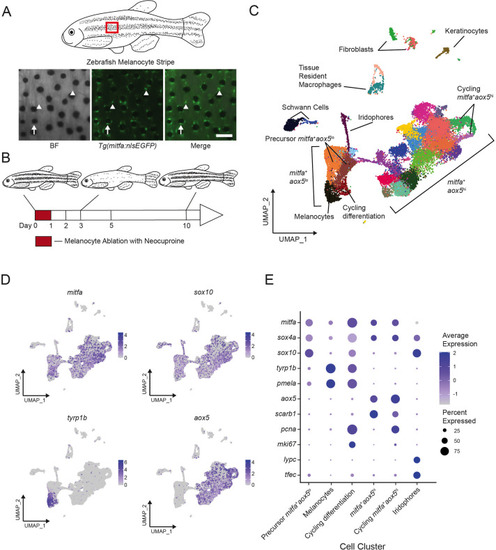
Single-cell transcriptomic identification of melanocyte lineage cells during regeneration.
(A) Top, diagram of zebrafish flank with melanocyte stripes. Bottom, representative images of the melanocyte stripe in a Tg(mitfa:nlsEGFP) zebrafish. Melanocyte progenitors are unpigmented GFP-expressing cells (arrowheads) admixed with pigmented melanocytes (arrows). Animals were treated with epinephrine prior to imaging to concentrate melanosomes into the cell body of melanocytes. Scale bar = 100 µm. (B) Experimental design for transcriptional profiling of progenitors in Tg(mitfa:nlsEGFP) zebrafish during melanocyte ablation and regeneration. Cells from Tg(mitfa:nlsEGFP) zebrafish were sampled at the days specified. (C) UMAP of cell-type assignments for clusters of cells obtained from Tg(mitfa:nls:EGFP) zebrafish. Cells from all time points were included. Coloring is according to unsupervised clustering (Blondel et al., 2008; Stuart et al., 2019). Cells are labeled based on gene expression patterns revealed in panels (D) and (E) and Figure 1—figure supplement 2A. The large group of cells to the bottom left in the UMAP are mitfa+aox5lo. Within this group of cells, the mitfa+aox5lotyrp1b+pcna− cells are designated as melanocytes, the mitfa+aox5lotyrp1b+pcna+ are designated ‘cycling differentiation’, and the other two populations are designated ‘precursor mitfa+aox5lo’. The larger group of cells to the bottom right in the UMAP are mitfa+aox5hi. Within this group of cells two clusters are pcna+ are designated ‘cycling mitfa+aox5hi’ (n = 29,453 cells). (D) Expression of pigment cell markers mitfa and aox5, melanin biosynthesis gene tyrp1b and pigment cell progenitor marker sox10 shown as feature plots on the UMAP plot from (C). (E) Expression of pigment cell markers, the stem cell gene sox4a, and cell cycle markers for cell clusters shown in panel C. Dot sizes represent percentage of cells in the cluster expressing the marker and coloring represents average expression. |

