- Title
-
Pigment cell progenitor heterogeneity and reiteration of developmental signaling underlie melanocyte regeneration in zebrafish
- Authors
- Frantz, W.T., Iyengar, S., Neiswender, J., Cousineau, A., Maehr, R., Ceol, C.J.
- Source
- Full text @ Elife
|
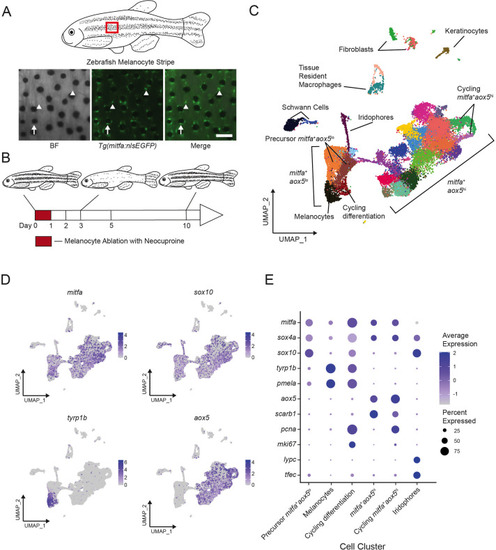
Single-cell transcriptomic identification of melanocyte lineage cells during regeneration.
(A) Top, diagram of zebrafish flank with melanocyte stripes. Bottom, representative images of the melanocyte stripe in a Tg(mitfa:nlsEGFP) zebrafish. Melanocyte progenitors are unpigmented GFP-expressing cells (arrowheads) admixed with pigmented melanocytes (arrows). Animals were treated with epinephrine prior to imaging to concentrate melanosomes into the cell body of melanocytes. Scale bar = 100 µm. (B) Experimental design for transcriptional profiling of progenitors in Tg(mitfa:nlsEGFP) zebrafish during melanocyte ablation and regeneration. Cells from Tg(mitfa:nlsEGFP) zebrafish were sampled at the days specified. (C) UMAP of cell-type assignments for clusters of cells obtained from Tg(mitfa:nls:EGFP) zebrafish. Cells from all time points were included. Coloring is according to unsupervised clustering (Blondel et al., 2008; Stuart et al., 2019). Cells are labeled based on gene expression patterns revealed in panels (D) and (E) and Figure 1—figure supplement 2A. The large group of cells to the bottom left in the UMAP are mitfa+aox5lo. Within this group of cells, the mitfa+aox5lotyrp1b+pcna− cells are designated as melanocytes, the mitfa+aox5lotyrp1b+pcna+ are designated ‘cycling differentiation’, and the other two populations are designated ‘precursor mitfa+aox5lo’. The larger group of cells to the bottom right in the UMAP are mitfa+aox5hi. Within this group of cells two clusters are pcna+ are designated ‘cycling mitfa+aox5hi’ (n = 29,453 cells). (D) Expression of pigment cell markers mitfa and aox5, melanin biosynthesis gene tyrp1b and pigment cell progenitor marker sox10 shown as feature plots on the UMAP plot from (C). (E) Expression of pigment cell markers, the stem cell gene sox4a, and cell cycle markers for cell clusters shown in panel C. Dot sizes represent percentage of cells in the cluster expressing the marker and coloring represents average expression. |
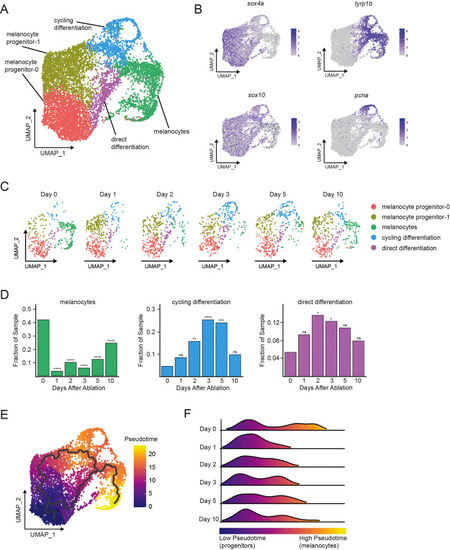
|
(A) Integrated subclustering of WT mitfa+aox5lo cells before, during, and after melanocyte regeneration (n = 5619 cells). Coloring is according to unsupervised clustering (Blondel et al., 2008; Stuart et al., 2019). Cell clusters are labeled based on gene expression patterns and inferred trajectories during regeneration, as revealed in panels (B–F) and Figure 2—figure supplement 1. Melanocyte and cycling differentiation clusters are the same as in Figure 1A, whereas the two precursor mitfa+aox5lo clusters from Figure 1A are now resolved into three clusters: melanocyte progenitor-0 (MP-0), melanocyte progenitor-1, and ‘direct differentiation’, the latter of which expresses the stem cell marker sox4a, the melanin biosynthesis gene tyrp1b and is pcna negative. (B) Expression of stem cell marker sox4a, melanin biosynthesis gene tyrp1b, pigment cell progenitor marker sox10, and cell cycle gene pcna as feature plots on the UMAP plot from (A). (C) Dynamic changes in subpopulations of WT mitfa+aox5lo cells. Biological sample runs were downsampled to a common number of total cells so shifts in cluster proportions could be readily visualized. (D) Quantification of proportion of cells per scRNAseq sample, comparing the indicated time point to day 0, in the melanocyte, cycling differentiation, and direct differentiation subpopulations during regeneration in WT animals (Day 0 = 7989, Day 1 = 4004, Day 2 = 4510, Day 3 = 5224, Day 5 = 3483, Day 10 = 4243 total cells per sample). p values calculated using differential proportion analysis (Farbehi et al., 2019), *p < 0.05; **p < 0.01; ***p < 0.001; ****p < 0.0001; ns, not significant. (E) Cellular trajectories, as determined by Monocle3 (Cao et al., 2019) projected onto the mitfa+aox5lo subcluster (left panel). Solid lines represent trajectories, with an origin in the MP-0 subpopulation and two distinct paths through different intermediate cell subpopulations. (F) These trajectories are then used to calculate pseudotime, which, as an approximation of biological time, reveals how low pseudotime progenitors (blue) progress across transitional cell types to high pseudotime melanocytes (yellow). Ridge plot of the distribution of pseudotime during regeneration. Height of ridge corresponds to number of cells at that pseudotime.
|
|
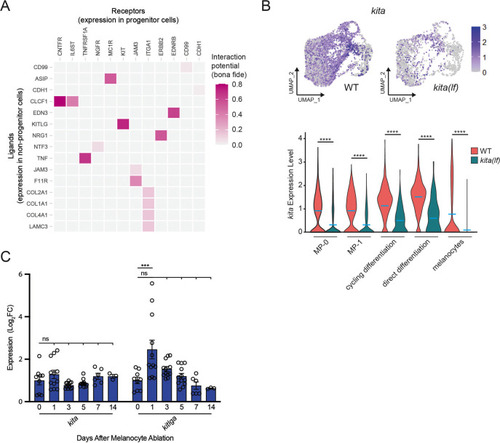
(A) Heatmap of NicheNetR-identified ligand/receptor pairs indicating interaction potential between receptors on progenitor receiver cells and ligands on non-progenitor sender cells sampled by scRNAseq. Ligand/receptor pairs were restricted to literature-supported pairs (Browaeys et al., 2020). (B) Top, feature and, bottom, violin plots of kita expression in mitfa+aox5lo cells from wild-type (MP-0 = 1840, MP-1 = 1408, cycling differentiation = 777, direct differentiation = 535, and melanocytes = 1060 cells) and kita(lf) strains (MP-0 = 617, MP-1 = 612, cycling differentiation = 280, direct differentiation = 57, and melanocytes = 563 cells). Mean gene expression represented by cyan bars. p values calculated by Wilcoxon rank-sum test, ****p < 0.0001. (C) Quantitative real-time polymerase chain reaction (qRT-PCR) of kita and kitlga expression in zebrafish skin following melanocyte destruction. Three biological replicates were performed for each time point. Data are shown as mean ± standard error of the mean (SEM). p values calculated by one-way analysis of variance (ANOVA) with Dunnett’s multiple comparisons test, ***p < 0.001; ns, not significant.
|
|
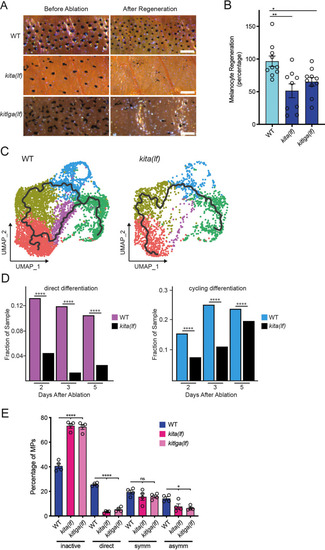
(A) Brightfield images of the melanocyte stripe before melanocyte ablation and after melanocyte regeneration in wild-type, kita(lf), and kitlga(lf) zebrafish strains. Scale bar = 200 µm. (B) Quantification of melanocyte regeneration in wild-type, kita(lf), and kitlga(lf) strains. Mean percentage ± standard error of the mean (SEM) is shown; WT n = 10, kita(lf) = 9, kitlga(lf) = 11 fish. p values calculated by one-way analysis of variance (ANOVA) with Dunnett’s multiple comparisons test, *p < 0.05, **p < 0.01. (C) Cellular trajectories, using Monocle3, of mitfa+aox5lo cells from wild-type zebrafish (left) and kita(lf) mutants (right). Solid lines represent trajectories, with an origin in the melanocyte progenitor-0 (MP-0) subpopulation and terminus in the melanocyte subpopulation. (D) Comparison of proportion of WT and kita(lf) cells per scRNAseq sample in the cycling differentiation and direct differentiation subpopulations during regeneration reveals fewer kita(lf) cells going through differentiation (WT Day 2 = 4510, WT Day 3 = 5224, WT Day 5 = 3483, kita(lf) Day 2 = 4233, kita(lf) Day 3 = 5261, kita(lf) Day 5 = 5411 total cells per sample). p values calculated using differential proportion analysis (Farbehi et al., 2019), ****p < 0.0001; ns, not significant. (E) Fates of progenitors following single-cell serial imaging of wild-type, kita(lf), and kitlga(lf) strains. Mean percentage of traced progenitors in a fate are shown; wild-type n = 4 animals (n = 49, 59, 53, 53 cells per animal), kita(lf) = 4 animals (n = 50, 50, 53, 28 cells per animal), kitlga(lf) = 4 animals (n = 52, 39, 53, 33 cells per animal). p values calculated by one-way ANOVA with Dunnett’s multiple comparisons test, ****p < 0.0001, *p < 0.05, ns, not significant.
|
|
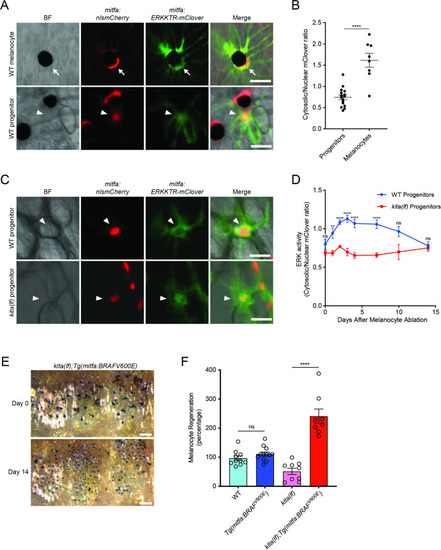
(A) Images of ERKKTR-mClover localization in a representative mature melanocyte (top, arrow) and progenitor (bottom, arrowhead) in uninjured wild-type animals. Scale bar = 30 µm. (B) Quantification of ERK activity in progenitors and melanocytes based on ERKKTR-mClover localization. Mean ± standard error of the mean (SEM) is shown; progenitors n = 16, melanocytes n = 8. (C) Images 3 days post-ablation of ERKKTR-mClover location in representative progenitors (arrowheads) in wild-type (top) and kita(lf) (bottom) animals. Scale bar = 30 µm. (D) Quantification of ERK activity in progenitors prior to and during melanocyte regeneration. For each data point, the average cytosolic/nuclear ratio of at least 6 cells ± SEM is shown. (E) Brightfield images of the melanocyte stripe before (top) and after (bottom) regeneration in kita(lf); Tg(mitfa:BRAFV600E) mutants. Scale bar = 200 µm. (F) Quantification of melanocyte regeneration in kita(lf);Tg(mitfa:BRAFV600E) and control animals. Mean percentage ± SEM is shown; wild-type n = 10, Tg(mitfa:BRAFV600E) = 12, kita(lf) = 9, kita(lf);Tg(mitfa:BRAFV600E) = 8 fish. p values calculated by Student’s t-test, **p < 0.01, ****p < 0.0001; ns, not significant.
|
|
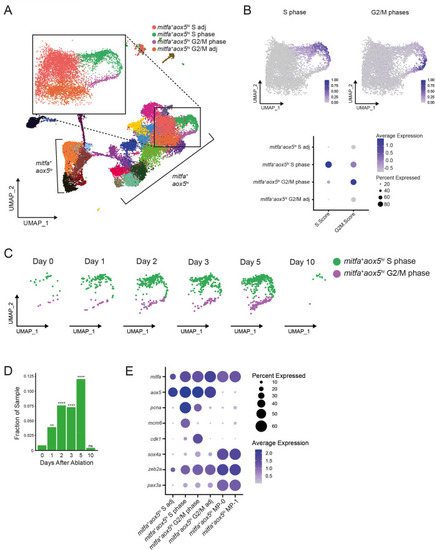
(A) UMAP of all cells sampled from wild-type animals with enlargement of cycling and adjacent subpopulations found in the large group of mitfa+aox5hi cells. (B) Top, feature and, bottom, dot plot of S phase and G2/M phase cell cycle scores of cells highlighted in (A). Cell cycle scores were calculated using Seurat’s ‘CellCycleScoring’ module and zebrafish orthologs of the cell cycle genes outlined by Tirosh et al., 2016. (C) UMAPs of cycling cells prior to and during regeneration. Biological sample runs were downsampled to a common number of total cells so shifts in clusters could be readily visualized. Cells in S phase are seen in green, and cells in G2/M phase are seen in purple. (D) Quantification of proportion of cells per scRNAseq sample in the mitfa+aox5hi cycling subpopulations (mitfa+aox5hi S phase and mitfa+aox5hi G2/M subpopulations combined) during regeneration (Day 0 = 7989, Day 1 = 4004, Day 2 = 4510, Day 3 = 5224, Day 5 = 3483, Day 10 = 4243 total cells per sample). p values calculated using differential proportion analysis (Farbehi et al., 2019), **p < 0.01; ****p < 0.0001; ns, not significant. (E) Dot plot of pigment cell and cell cycle marker genes differentially expressed across S adj, cycling, and G2/M adj mitfa+aox5hi subpopulations during melanocyte regeneration. Dot sizes represent percentage of cells in the cluster expressing the marker and coloring represents average expression.
|
|
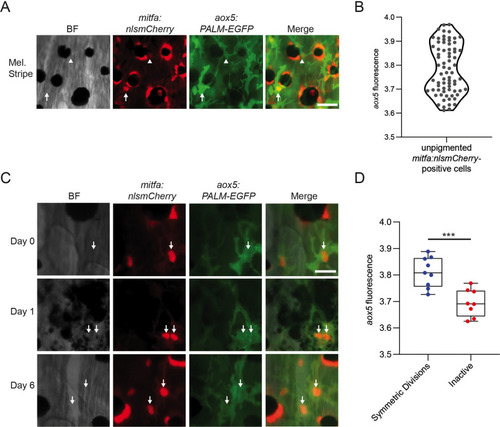
(A) Representative image of progenitors expressing different levels of aox5 promoter-driven PALM-EGFP. mitfa+aox5hi (arrowhead), mitfa+aox5lo (arrow). Scale bar = 50 µm. (B) Quantification of PALM-EGFP fluorescence intensity indicates groups of progenitors that express lower and higher levels of aox5. Mean pixel intensity per area; intensity values log normalized. n = 73 cells from 5 animals. (C) Images of an mitfa+aox5hi cell that underwent mitosis following melanocyte destruction. Scale bar = 30 µm. (D) Comparison of aox5 intensity in cells that underwent symmetric divisions or remained inactive. Mean pixel intensity per area; intensity values log normalized. n = 17 cells from 5 animals. p values calculated by Student’s t-test, ***p < 0.001.
|

