
Figure 2
- ID
- ZDB-FIG-230420-63
- Publication
- Guan et al., 2023 - Ghrelin regulates hyperactivity-like behaviors via growth hormone signaling pathway in zebrafish (Danio rerio)
- Other Figures
- All Figure Page
- Back to All Figure Page
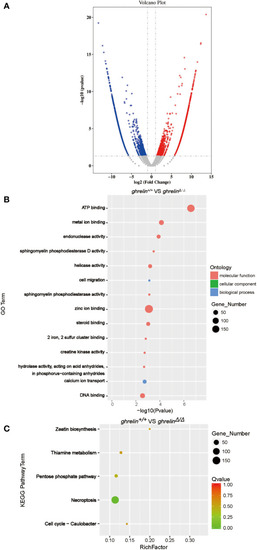
Transcriptome profile of the brain of adult ghrelinΔ/Δ zebrafish. (A) Volcano plot of DEGs in ghrelin+/+ and ghrelinΔ/Δ . Splashes represent different genes, and the gray splashes mean genes without significant different expression. The red splashes mean significantly up-regulated genes in ghrelinΔ/Δ , and the blue splashes mean significantly down-regulated genes in ghrelinΔ/Δ . (B) GO enrichment histogram, the ordinate is the enriched GO term, and the abscissa is the P value. The size of the dot indicates the number of differentially. Different colors are used to distinguish biological processes, cellular components, and molecular functions. (C) Differential gene KEGG enrichment scatter plot, the vertical axis represents the name of the pathway, the horizontal axis represents the Rich factor, the size of the dot indicates the number of differentially expressed genes in this pathway, and the color of the dot corresponds to different Q value ranges. |