
- Title
-
Ghrelin regulates hyperactivity-like behaviors via growth hormone signaling pathway in zebrafish (Danio rerio)
- Authors
- Guan, K., Shan, C., Guo, A., Gao, X., Li, X.
- Source
- Full text @ Front Endocrinol (Lausanne)

GhrelinΔ/Δ zebrafish exhibited hyperactivity-like behaviors. (A) Representative images of zebrafish swimming path. (B, C) Quantification of the spontaneous swimming distance of zebrafish. The swimming distance of the zebrafish (ghrelin+/+ zebrafish, n=18 GhrelinΔ/Δ zebrafish, n=15) under the dark (D), light stimulation (E) and light (F) conditions were measured. *P < 0.05, **P < 0.01, ***P < 0.001,****P < 0.0001, unpaired Student's t-test. |
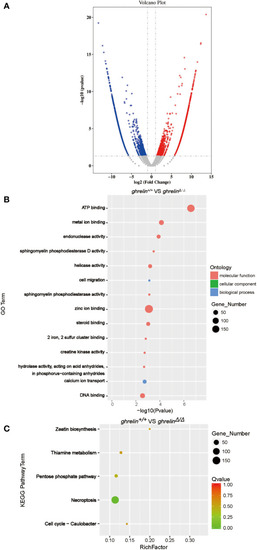
Transcriptome profile of the brain of adult ghrelinΔ/Δ zebrafish. (A) Volcano plot of DEGs in ghrelin+/+ and ghrelinΔ/Δ . Splashes represent different genes, and the gray splashes mean genes without significant different expression. The red splashes mean significantly up-regulated genes in ghrelinΔ/Δ , and the blue splashes mean significantly down-regulated genes in ghrelinΔ/Δ . (B) GO enrichment histogram, the ordinate is the enriched GO term, and the abscissa is the P value. The size of the dot indicates the number of differentially. Different colors are used to distinguish biological processes, cellular components, and molecular functions. (C) Differential gene KEGG enrichment scatter plot, the vertical axis represents the name of the pathway, the horizontal axis represents the Rich factor, the size of the dot indicates the number of differentially expressed genes in this pathway, and the color of the dot corresponds to different Q value ranges. |

Quantitative real-time PCR analysis of candidate genes in the brain of adult ghrelinΔ/Δ zebrafish. (A–G) In order, the investigated genes are stat5b, map2k2b, adcy1a, gh1, atf2, itpr1b, itpr2. N= 3, *P < 0.05, **P < 0.01, ****P < 0.0001, unpaired Student's t-test. |

Quantitative real-time PCR analysis of candidate genes in 5 dpf ghrelinΔ/Δ zebrafish larvae (A–G) In order, the investigated genes are stat5b, map2k2b, adcy1a, gh1, atf2, itpr1b, itpr2. N= 3, Mean ± SEM. *P < 0.05, **P < 0.01, ***P < 0.001, NS=no significance,unpaired Student's t-test. |
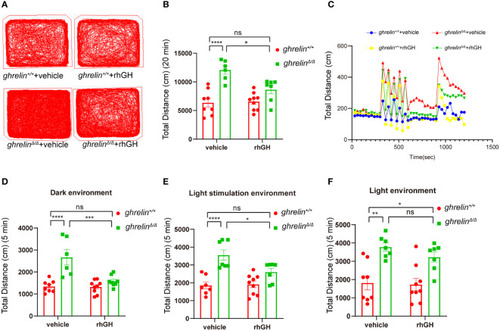
Treatment of rhGH alleviated the hyperactivity-like phenotype of ghrelinΔ/Δ zebrafish. (A) Representative images of zebrafish swimming tracks. (B) Quantification of the spontaneous locomotor distance of zebrafish over 20 min (Mean ± SEM. **P<0.05, ****P<0.0001, NS=no significance, F 1,26 (interaction) =6.884, two-way ANOVA). (C) The activity recorded was the mean average swimming distance of adult ghrelinΔ/Δ and adult ghrelin+/+ zebrafish during 20 min under light-changing condition (first 5 min dark, next 5 min light stimulation, then 5 min dark, and finally 5 min light). (D) The swimming distance of the zebrafish is in the dark (Mean ± SEM. *P<0.05, ****P<0.0001, NS=no significance, F 1,27 (interaction) =10.84, two-way ANOVA). (E) The swimming distance of zebrafish under light stimulation (Mean ± SEM. *P<0.05, ****P<0.0001, NS=no significance, F 1,26 (interaction) =5.173, two-way ANOVA). (F) The swimming distance of zebrafish in the light (Mean ± SEM.*P<0.05, ****P<0.0001, NS=no significance, F 1,27 (interaction) =0.5135, two-way ANOVA). (Ghrelin+/+ zebrafish injection vehicle, n=8; ghrelin+/+ zebrafish injection rhGH, n=9; and ghrelinΔ/Δ zebrafish injection vehicle, n=7, ghrelinΔ/Δ zebrafish injection rhGH, n=8). |