
Fig. 3
- ID
- ZDB-FIG-230420-55
- Publication
- Yabe et al., 2023 - Ripply suppresses Tbx6 to induce dynamic-to-static conversion in somite segmentation
- Other Figures
- All Figure Page
- Back to All Figure Page
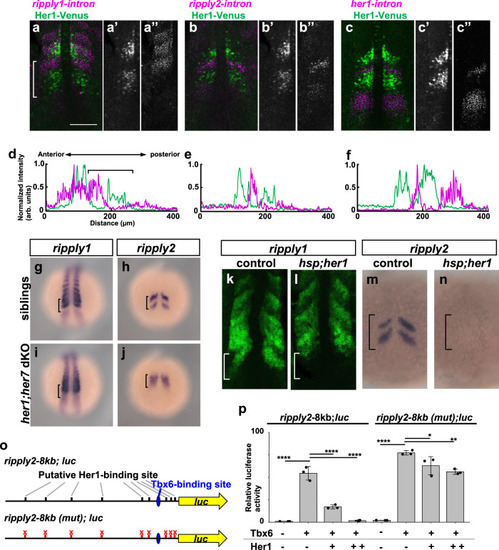
a–f Comparison of ripply1, ripply2 and her1 transcribing areas with Her1 protein-expressing area. The Her1 protein-expressing area was represented by IHC using anti-GFP antibody in TG(her1:her1-venus) heterozygous embryos (green). ripply1, ripply2 and her1-expressing areas are represented by FISH using intron probes for ripply1 (a; n = 8), ripply2 (b; n = 8) and her1 (c; n = 4) to detect nascent mRNAs, respectively (magenta). Left-half images of individual channels are shown in right panels. A white bracket indicates the position of the anterior PSM. Scale bar indicates 100 µm. d–f Signal intensity plots of (a–c) with anterior toward the left. A black bracket indicates the position of the anterior PSM. g–j Analysis of ripply1 (g, i) and ripply2 (h, j) expression in her1;her7 double-mutant embryo. WT (g; n = 15, h; n = 16) and her1k1060/kt1060; her7kt1061/kt1061 (i; n = 10, j; n = 11) embryos were fixed at 8–9 somite stage. k–n Analysis of effects of her1 overexpression on the ripply1 (k; n = 7, l; n = 5) and ripply2 (m; n = 11, n; n = 13) expression. Embryos obtained by crossing Tg(hsp:her1)/+ males with wild-type females were fixed at the 8–9-somite stage after 30 min incubation at 37 °C. o, p Reporter assay showing effects of her1 expression on the activity of the ripply2 promoter using HEK293T cells. o Schematic image of a reporter construct used for the reporter assay. The putative Her1/Her7 binding site indicates previously identified zebrafish Her1/Her7 consensus binding sequences, CACGNG. In the ripply2-8kb (mut)-luc construct, all CACGNG motifs were substituted to AAAGNG or AAAAAA. Crosses under each bar indicates amounts of plasmids used for transfection. Average of normalized firefly luciferase activity with pCS2+ (mock) alone was set at 1. Error bars represent standard deviations (n = 3 in each experiment). Differences of relative luciferase activity were statistically evaluated using one-way ANOVA followed by the Tukey–Kramer test. *p = 0.03, **p = 0.001 ****p < 0.0001. |