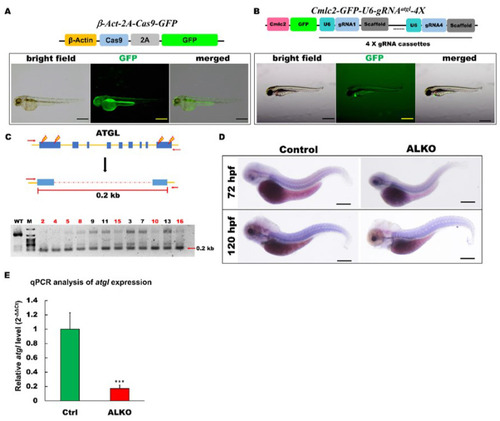
Generation of zebrafish ALKO mutant using CRIPRC-Cas9 system. (A) Schematics of the structure of β-Act-2A-Cas9-GFP expression vector. The transcriptional activity of Cas9 elements (sky blue) was driven by β-actin 2.5k promoter (yellow). The lower panel shows the fluorescence pattern of Tg (β-Act-2A-Cas9-GFP) with a global expression of GFP at 2 days post-fertilization (dpf). Scale bar: 500 μm. (B) Schematics of the structure of Cmlc2-GFP-U6-gRNAatgl-4X expression vector. The GFP expression represented the success of transgenesis of Tg (Cmlc2-GFP-U6-gRNAatgl-4X) at 5 dpf. Scale bar: 600 μm. (C) Upper: Schematic diagram of the outer primers of atgl loci used for PCR detection of mutations. The outer primers are to the mutated site/scheme of the locations of PCR primers (red arrows) designed to detect a disruption in the spacer between the first exon and the last one. Yellow lightening symbols denote the site of four selective gRNAs; navy blue boxes denote all of the exons in the atgl loci; red dashed line denotes the spacer; red line denotes the length between external primers without the spacer. Lower: Result of semi-qRT–PCR analyses on the whole embryo of transient F0 fish containing the corresponding mutations (as indicated in the upper panel of C). (D) Whole-mount in situ hybridization showing the reduction of atgl in ALKO mutant larvae at 120 hpf. Scale bars = 80 μm. (E) Quantitative of atgl expression by RT-qPCR analysis at 7 dpf. Heterozygous ALKO mutants were generated by cross-homozygous Tg (β-Act-2A-Cas9-GFP) and Tg (Cmlc2-GFP-U6-gRNAatgl-4X). Control: Heterozygous Tg (Cmlc2-GFP-U6-gRNAatgl-4X). *** (p < 0.001) indicates statistically significant differences from the controls. Value of atgl in ALKO = 0.1721 ± 0.0421.
|

