
Fig. 2
- ID
- ZDB-FIG-221020-21
- Publication
- Kuhn et al., 2022 - Single-molecule tracking of Nodal and Lefty in live zebrafish embryos supports hindered diffusion model
- Other Figures
- (all 6)
- All Figure Page
- Back to All Figure Page
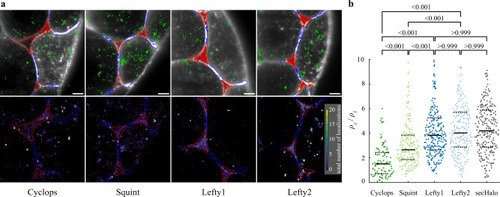
Localization of morphogens in cell-cell interfaces and extracellular cavities.
a Top: Overlay of the memGFP signal, the manually curated ROI separating cell-cell-interfaces (blue, I) and extracellular cavities (red, C); tracks assigned to interfaces (blue), cavities (red) and not assigned (green) are also shown. Bottom: Tracking-and-localization-microscopy (TALM) image showing the total number of localizations over 1000 frames or 11.7 s in each 2 × 2 pixel bin; scale bar: 5 µm. b Ratios of localization densities in cavities and interfaces calculated for each movie (for statistics see Supplementary Table 5). Values above 10 are not displayed (3.4% of all movies). p-values (Cyclops - Squint, Cyclops - Lefty1, Cyclops - Lefty2, Squint - Lefty1, Squint - Lefty2: <0.001; Lefty1 - Lefty2, Lefty1 - secHalo, Lefty2 -secHalo: >0.999) were calculated using the Kruskal-Wallis-Test. Solid black lines indicate the median values, dashed black lines the 0.25 and 0.75 quantiles. Source data are provided as a Source Data file for Fig. 2b. |