
Fig. 3
- ID
- ZDB-FIG-221018-57
- Publication
- Huang et al., 2022 - Intrinsic myocardial defects underlie an Rbfox-deficient zebrafish model of hypoplastic left heart syndrome
- Other Figures
- All Figure Page
- Back to All Figure Page
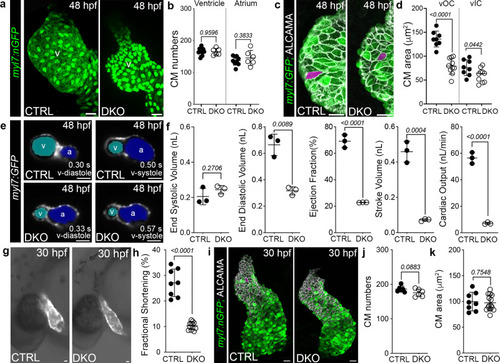
Impaired myocardial function is the earliest cardiovascular defect observed in Rbfox-deficient embryos.
a Confocal projections of 48 hpf CTRL and DKO hearts carrying the Tg(myl7:nGFP) transgene immunostained for GFP (green). b Dot plot showing cardiomyocyte numbers. c Confocal projections of 48 hpf ventricular OCs from CTRL and DKO embryos carrying the Tg(myl7:GFP) reporter immunostained for GFP (green) and ALCAMA (white). Magenta overlay of OC cardiomyocytes. d Dot plot showing the average area of ventricular OC and IC cardiomyocytes. e Single-plane images of 48 hpf CTRL and DKO embryos carrying the Tg(myl7:GFP) transgene. Atrial (blue) and ventricular (cyan) lumens are shown. f Dot plots showing ventricular end-systolic volume (ESV) and end-diastolic volume (EDV) measured with CFIN that were used to calculate ejection fraction (EF), stroke volume (SV), and cardiac output (CO). g Brightfield images with fluorescent overlay of Tg(myl7:GFP) reporter signal in 30 hpf CTRL and DKO embryos. h Dot plot showing % fractional shortening at the arterial pole. i Confocal projections of 30 hpf CTRL and DKO hearts carrying the Tg(myl7:nGFP) transgene immunostained with anti-GFP (green) and anti-ALCAMA (white). Magenta overlay of arterial pole cardiomyocytes. j, k Dot plots showing cardiomyocyte numbers and average cell areas. Sample sizes and Statistics: (b, f, h, j) Each dot represents one embryo. d Each dot represents the average area of 8 OC cardiomyocytes and 6 IC cardiomyocytes from 8 CTRL and 10 DKO hearts. k Each dot represents the average area of 8 cardiomyocytes from 8 CTRL and 12 DKO hearts. Data are presented as mean values +/− one SD. Statistical significance was determined by an unpaired, two-tailed Student’s t-test assuming equal variances. P values are shown. Source data are provided as a Source Data file. Abbreviations: v ventricle, a atrium, OC outer curvature, IC inner curvature. Scale bars: 20 μm. |
| Antibody: | |
|---|---|
| Fish: | |
| Anatomical Term: | |
| Stage: | Long-pec |
| Fish: | |
|---|---|
| Observed In: | |
| Stage Range: | Prim-15 to Long-pec |