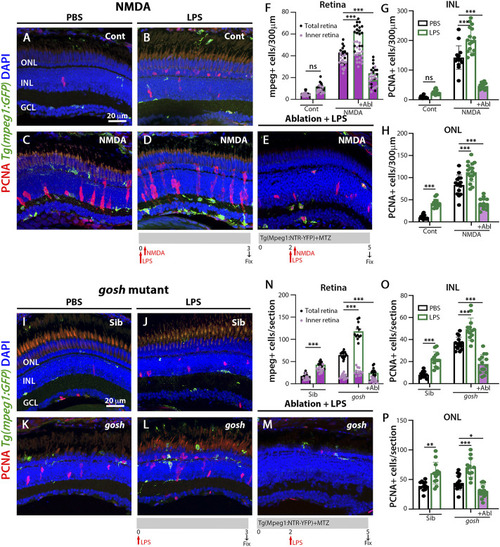
LPS-activated microglia enhance Müller glia proliferation in NMDA-injured retina and gosh mutant. Three wpf Tg(mpeg1:eGFP) fish with either PBS (A–C) or LPS (B–D) and injected 3 h slater with either buffer (A,B) or NMDA (C–E) and collected 69 h later for immunostaining. Microglia/macrophages are visualized with the transgenic line. LPS-treated control retinas display a significantly greater number of PCNA-positive ONL cells compared to control retinas (A,B,H). LPS-treatment of NMDA-damaged retinas significantly increases the numbers of activated microglia/macrophages and proliferating cells compared to PBS-injected NMDA-injured retinas (C,D,F–H). LPS-treatment of NMDA-damaged retinas with ablated microglia/macrophages display significantly fewer microglia/macrophages and PCNA-positive cells (E–H). LPS-injected gosh mutant eyes significantly increase microglia/macrophages reactivity and PCNA-labeled INL and ONL cells (K,L,N–P). LPS-injected gosh mutant fish with ablated microglia/macrophages possess significantly fewer microglia/macrophages and PCNA-positive cells (M–P). Histograms display the quantification of the number of eGFP-positive microglia/macrophages (F) or PCNA-labeled cells (G,H) in 300 μm of the central region of the NMDA-damaged retinas or in the entire section of gosh mutant retinas (N–P). Bars and lines indicate mean ± SEM, n = 12–17. Black bars: PBS injection; green bars: LPS injection; green bars with purple fill: LPS and ablated microglia/macrophages. Panels F and N: black dots display total number of mpeg:GFP + cells in the retina, and pink dots show total number of mpeg:GFP + cells in the inner retina. Two-way ANOVA with Tukey’s multiple comparisons test was applied for all the graphs (ns p > 0.05; *p < 0.05; **p < 0.01; ***p < 0.001).
|
