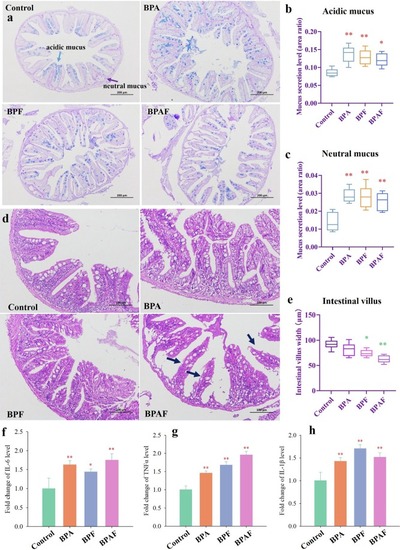
Fig. 3. Bisphenol analogues induced intestinal damage. a AB-PAS staining of zebrafish intestinal sections from control and bisphenol analogues treated groups. Blue dye marked acidic mucus and purple dye marked neutral mucus. b-c, Intestinal mucus level in control and bisphenol analogues treated groups based on the proportion of stained area of acidic mucus (b) and neutral mucus (c). d HE staining of zebrafish intestinal sections from control and bisphenol analogues treated groups. Black arrows marked the injury of intestinal villi post exposure. e Intestinal villus width of zebrafish in control and bisphenol analogues treated groups. f-h, Protein level of three inflammatory cytokines, Il-6 (f), Tnfα (g) and Il-1β (h). Asterisks denote significant differences between treatments and the control (determined by a Dunnett’s post hoc comparison; *, p < 0.05; **, p < 0.01). Error bars indicate the standard deviation. (For interpretation of the references to colour in this figure legend, the reader is referred to the web version of this article.)
|
