|
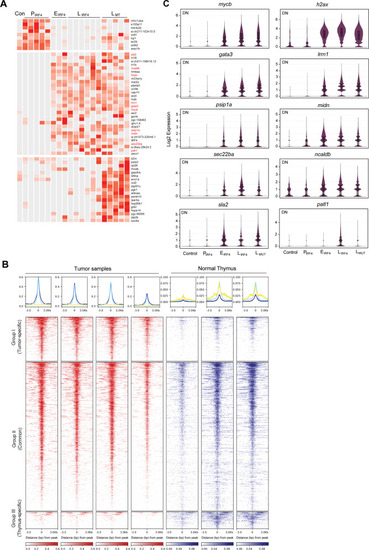
IRF4-driven tumors are characterized by high expression of <italic>mycb</italic> and <italic>gata3</italic>.A Heatmap showing the significantly upregulated genes from one-to-one differential gene analysis of scRNA-seq data between DN populations of different tumor stages. B Density plots (bottom) show the distribution of H3K27ac signals in tumor and normal thymus samples. All significant peaks (FDR < 0.05) were first detected and then classified into three classes of regions (Groups I-III). The color scale represents the intensity of signals and distances (3,000 bps) from the center (0) of peaks. Metagene plots (top) show the distribution of H3K27ac signals from the center for Group I (log2FC ≥ 1) (blue), Group II (−1 < log2FC < 1) (light blue) and Group III (log2FC ≤ −1) (yellow) regions. C Violin plots showing the expression of ten genes in DN cell populations across tumor stages analyzed by scRNA-seq (total cell number after merging of biologically independent samples: Control n = 557 cells; PIRF4n = 2,222 cells; EIRF4n = 3,365; LIRF4n = 15,280 cells; LMTn = 28,205 cells). Black vertical line indicates max and min values. Box indicates the third and first quartiles. Horizontal lines in the box indicate mean and median values. Source data are provided as a Source Data file.
|