
Figure 3—figure supplement 3
- ID
- ZDB-FIG-211224-23
- Publication
- Choi et al., 2021 - Specialized neurons in the right habenula mediate response to aversive olfactory cues
- Other Figures
-
- Figure 1
- Figure 1—figure supplement 1.
- Figure 1—figure supplement 2—source data 1.
- Figure 1—figure supplement 3.
- Figure 2
- Figure 3
- Figure 3—figure supplement 1
- Figure 3—figure supplement 2.
- Figure 3—figure supplement 3
- Figure 3—figure supplement 4.
- Figure 4
- Figure 4—figure supplement 1
- Figure 5
- Figure 5—figure supplement 1
- All Figure Page
- Back to All Figure Page
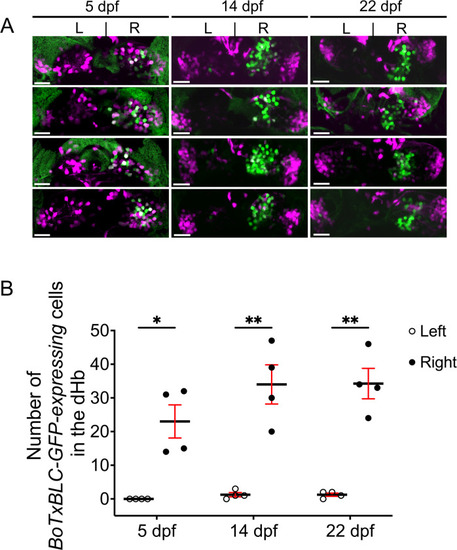
Variability in BoTxBLC-GFP labeling of dHb neurons. (A) Dorsal views of Tg(lratd2a:QF2), Tg(slc5a7a:Cre), Tg(QUAS:loxP-mCherry-loxP-BoTxBLC-GFP) zebrafish at 5, 14, and 22 dpf showing persistence and variability in labeling of lratd2a right Hb neurons. Four different individuals are shown at each stage (12 total). Scale bar, 25 μm. (B) Quantification of BoTxBLC-GFP-expressing neurons at 5 dpf [none in left dHb, 23 ± 4.92 in right dHb], 14 dpf [1.25 ± 0.63 left, 34 ± 5.82 right] and 22 dpf [1.25 ± 0.48 left, 34.25 ± 4.52 right]. Two-way ANOVA reveals significant effects of left vs. right [F(1,3) = 245.7, p = 0.0006], but no effect of developmental stages [F(2,6) = 0.301] and interaction [F(2, 6) = 1.117]. Post-hoc analysis by Bonferroni’s multiple comparisons. Numbers represent the mean ± SEM. *p < 0.05; **p < 0.01. |