Fig. 3
- ID
- ZDB-FIG-211208-3
- Publication
- Mitsuzawa et al., 2021 - Reduced PHOX2B stability causes axonal growth impairment in motor neurons with TARDBP mutations
- Other Figures
- All Figure Page
- Back to All Figure Page
|
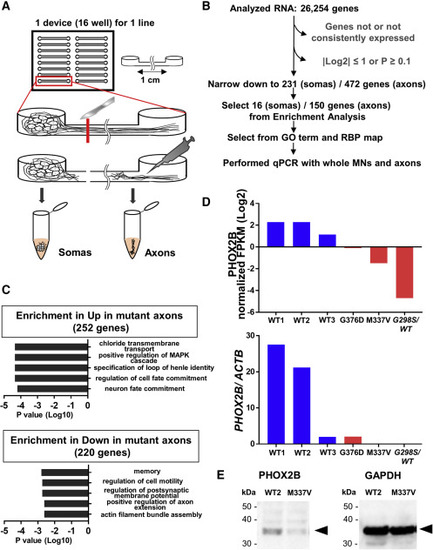
(A) Schema illustrating isolation of somas and axons from iPSC-derived MNs using microfluidic chambers. (B) Selection of candidate genes associated with TARDBP mutation-induced axonal pathology based on RNA-seq. The number of candidates was reduced from 26,254 to 231 in somas and 472 in axons on normalized fragments per kilobase of the exon model per million mapped fragments (FPKM) values |log2| > 1 and p < 0.1 (Student’s t test). From enrichment analysis, 16 genes (all genes were downregulated in the mutant) were significantly changed in the soma fraction, and 150 genes (103 genes were upregulated and 47 genes were downregulated in the mutant) were in the axon fraction. PHOX2B was selected from GO term (related to nerves, axons, transport, cytoskeleton, and inflammation), RBP map, and qPCR. See also Tables S4, S5, S6, and S7. (C) Enrichment analysis revealed significant upregulation of transcripts associated with chloride transmembrane transport, the MAPK cascade, and cell or neuron fate commitment in TARDBP mutant axons (252 genes, upper panel). By contrast, transcripts associated with memory, cell motility, postsynaptic membrane potential, and axon- or actin-related genes were significantly downregulated (220 genes, lower). (D) PHOX2B was selected from RNA-seq results. The upper graph shows RNA-seq results (normalized FPKM) and the lower graph shows qPCR results (PHOX2B/ACTB [β-actin]). PHOX2B normalized FPKM were decreased in TARDBP mutant axons. PHOX2B mRNA expression was also equal or decreased in the mutant axons with qPCR using RNA samples for RNA-seq under independent triplicates per sample. See also Figure S1B for qPCR results of N345K. (E) PHOX2B protein expression was examined by western blotting. Expression of PHOX2B (32 kDa, arrowhead) was substantially lower in TARDBP mutant MNs (M337V) compared with that in healthy control MNs (WT2), consistent with the mRNA expression pattern measured by RNA-seq and qPCR. GAPDH (37 kDa, arrowhead) was used as the gel loading control. |

