
Figure 3
- ID
- ZDB-FIG-210714-34
- Publication
- Lord et al., 2021 - The pattern of Nodal morphogen signaling is shaped by co-receptor expression
- Other Figures
- All Figure Page
- Back to All Figure Page
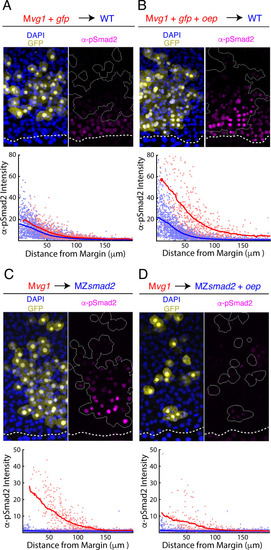
(A–B) Oep overexpression increases sensitivity to Nodal ligands. (A) Upper panel: control transplant of GFP-marked Mvg1 sensor cells (yellow) to the margin of wild-type hosts. Nodal signaling activity was measured by α-pSmad2 immunostaining (magenta). In all panels, YSL boundaries are marked with dashed white curves, and sensor cells have been outlined in solid white in all α-pSmad2 panels. Lower panel: quantification of Nodal signaling in sensor (red) and host cells (blue) across replicate embryos. Sliding window averages are plotted as solid curves. Plot was derived from eight replicate embryos. (B) Upper panel: transplant of sensor cells from an Mvg1 donor injected with gfp and 110 pg oep mRNA at the one-cell stage to the margin of wild-type hosts. Sensor cells (yellow) exhibit enhanced Nodal signaling activity (magenta) compared to their host-derived neighbors. Lower panel; staining of host (blue) and sensor (red) cells was quantified as in (A). Plot was derived from nine replicate embryos. (C-D) Oep overexpression restricts Nodal spread. (C) Upper panel: sensor cell measurement of the Nodal gradient in MZsmad2 embryos. Mvg1 sensor cells were marked with GFP (yellow), and Nodal signaling activity was measured by α-pSmad2 immunostaining (magenta). Lower panel: quantification of Nodal signaling in sensor (red) and host cells (blue) was quantified as in (A). Plot was derived from nine replicate embryos. (D) Upper panel: Mvg1 sensor cell measurement of the Nodal signaling gradient in MZsmad2 hosts injected with 110 pg oep mRNA at the one-cell stage. Lower panel; gradients were quantified as in (A). Plot was derived from nine replicate embryos. |